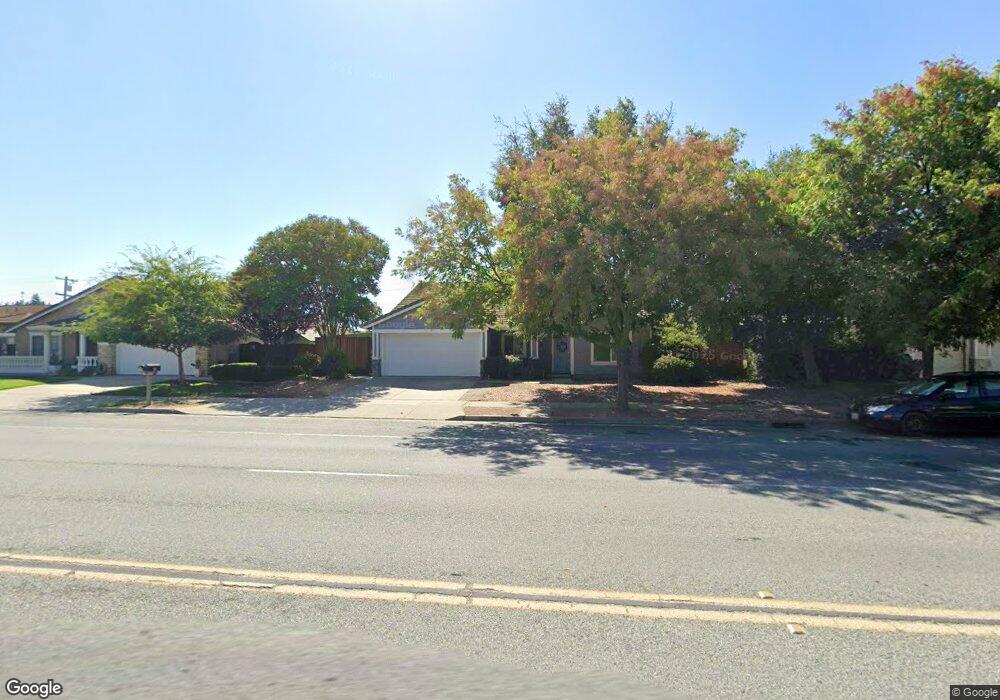
768 Mantelli Dr Gilroy, CA 95020
Las Animas NeighborhoodEstimated Value: $904,000 - $995,000
4
Beds
2
Baths
1,879
Sq Ft
$513/Sq Ft
Est. Value
About This Home
This home is located at 768 Mantelli Dr, Gilroy, CA 95020 and is currently estimated at $963,877, approximately $512 per square foot. 768 Mantelli Dr is a home located in Santa Clara County with nearby schools including Rod Kelley Elementary School, South Valley Middle School, and Solorsano Middle School.
Ownership History
Date
Name
Owned For
Owner Type
Purchase Details
Closed on
Dec 1, 2020
Sold by
Goularte Anthony V and Goularte Family Trust
Bought by
Sanders Jeffrey M and Burke Sanders Julie
Current Estimated Value
Home Financials for this Owner
Home Financials are based on the most recent Mortgage that was taken out on this home.
Original Mortgage
$600,000
Outstanding Balance
$535,131
Interest Rate
2.8%
Mortgage Type
New Conventional
Estimated Equity
$428,746
Purchase Details
Closed on
Mar 21, 2019
Sold by
Goularte Anthony V and Goularte 1991 Family Trust
Bought by
Goularte Anthony V and Goularte 1991 Family Trust
Purchase Details
Closed on
May 11, 2009
Sold by
Patterson Janice Lee
Bought by
Goularte Anthony and Goularte Jane K Reed
Purchase Details
Closed on
Feb 3, 2009
Sold by
Domer Jacob D
Bought by
Patterson Janice Lee
Create a Home Valuation Report for This Property
The Home Valuation Report is an in-depth analysis detailing your home's value as well as a comparison with similar homes in the area
Home Values in the Area
Average Home Value in this Area
Purchase History
| Date | Buyer | Sale Price | Title Company |
|---|---|---|---|
| Sanders Jeffrey M | $750,000 | Old Republic Title Company | |
| Goularte Anthony V | -- | None Available | |
| Goularte Anthony | $384,000 | Chicago Title Company | |
| Patterson Janice Lee | -- | None Available |
Source: Public Records
Mortgage History
| Date | Status | Borrower | Loan Amount |
|---|---|---|---|
| Open | Sanders Jeffrey M | $600,000 |
Source: Public Records
Tax History
| Year | Tax Paid | Tax Assessment Tax Assessment Total Assessment is a certain percentage of the fair market value that is determined by local assessors to be the total taxable value of land and additions on the property. | Land | Improvement |
|---|---|---|---|---|
| 2025 | $9,791 | $811,822 | $324,729 | $487,093 |
| 2024 | $9,791 | $795,905 | $318,362 | $477,543 |
| 2023 | $9,733 | $780,300 | $312,120 | $468,180 |
| 2022 | $9,572 | $765,000 | $306,000 | $459,000 |
| 2021 | $9,529 | $750,000 | $300,000 | $450,000 |
| 2020 | $5,843 | $452,146 | $248,680 | $203,466 |
| 2019 | $5,790 | $443,281 | $243,804 | $199,477 |
| 2018 | $5,408 | $434,590 | $239,024 | $195,566 |
| 2017 | $5,521 | $426,070 | $234,338 | $191,732 |
| 2016 | $5,407 | $417,717 | $229,744 | $187,973 |
| 2015 | $5,103 | $411,444 | $226,294 | $185,150 |
| 2014 | $5,071 | $403,386 | $221,862 | $181,524 |
Source: Public Records
Map
Nearby Homes
- 735 Painter Ct
- 401 Arnold Dr
- 760 Welburn Ave
- 1008 Primrose Ln
- 946 Martiri Ct
- 119 Farrell Ave
- 103 Farrell Ave
- 111 Farrell Ave
- 1206 Sycamore Ct
- 8170 Westwood Dr Unit 22
- 1165 Lerma Ln
- 1320 Heritage Way
- 170 Sturla Way
- 9400 Benbow Dr
- 626 Broadway
- 620 Broadway
- 622 Broadway
- 1404 Casablanca Cir
- 704 Tennyson Dr
- 1501 Welburn Ave
- 766 Mantelli Dr
- 772 Mantelli Dr
- 771 Ramona Way
- 777 Ramona Way
- 767 Ramona Way
- 762 Mantelli Dr
- 776 Mantelli Dr
- 781 Ramona Way
- 761 Ramona Way
- 9013 Brittany Ct
- 758 Mantelli Dr
- 782 Mantelli Dr
- 9012 Spencer Ct
- 787 Ramona Way
- 759 Ramona Way
- 9023 Brittany Ct
- 9016 Spencer Ct
- 770 Ramona Way
- 756 Mantelli Dr
- 788 Mantelli Dr
Your Personal Tour Guide
Ask me questions while you tour the home.