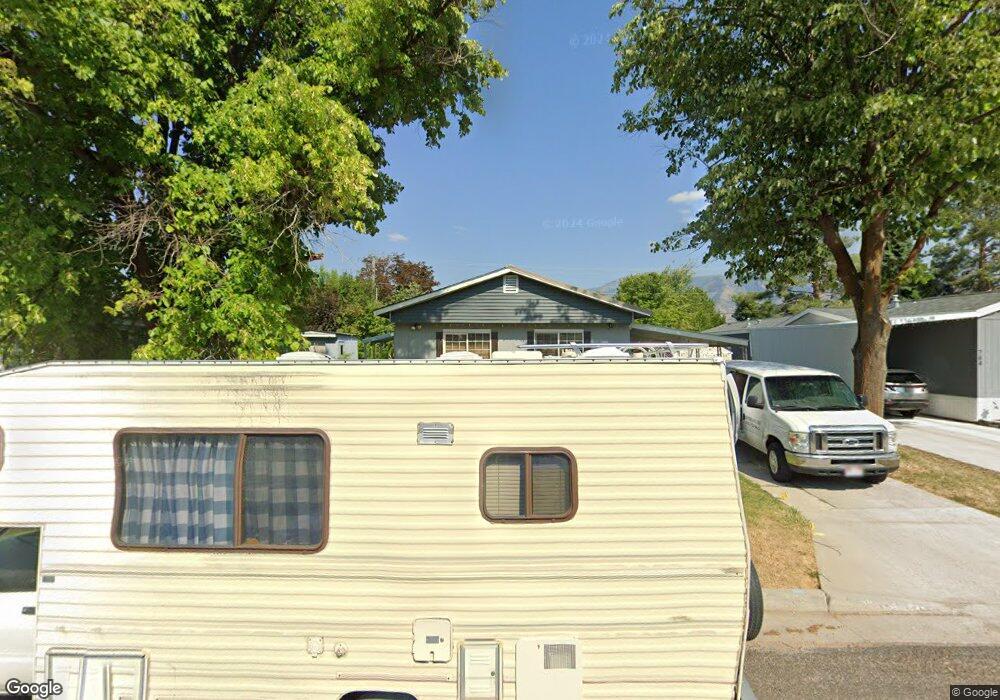
768 N 400 W Logan, UT 84321
Bridger NeighborhoodEstimated Value: $582,000 - $632,000
3
Beds
2
Baths
1,440
Sq Ft
$424/Sq Ft
Est. Value
About This Home
This home is located at 768 N 400 W, Logan, UT 84321 and is currently estimated at $610,766, approximately $424 per square foot. 768 N 400 W is a home located in Cache County with nearby schools including Bridger School, Mount Logan Middle School, and Logan High School.
Ownership History
Date
Name
Owned For
Owner Type
Purchase Details
Closed on
Dec 16, 2020
Sold by
Craney E Brody E and Craney Peggy S
Bought by
Craney E Brody E and Craney Peggy S
Current Estimated Value
Purchase Details
Closed on
Jun 2, 2020
Sold by
Craney E Brody E and Craney Peggy S
Bought by
Craney Edward Brody and Craney Peggy S
Home Financials for this Owner
Home Financials are based on the most recent Mortgage that was taken out on this home.
Original Mortgage
$258,000
Interest Rate
3.3%
Mortgage Type
New Conventional
Purchase Details
Closed on
Nov 16, 2006
Sold by
Craney E Brody
Bought by
Craney E Brody and Craney Peggy S
Home Financials for this Owner
Home Financials are based on the most recent Mortgage that was taken out on this home.
Original Mortgage
$275,000
Interest Rate
6.28%
Mortgage Type
New Conventional
Purchase Details
Closed on
Jul 8, 2005
Sold by
Stratford Kent and Stratford Jan Marie C
Bought by
Craney E Brody and Craney Peggy S
Home Financials for this Owner
Home Financials are based on the most recent Mortgage that was taken out on this home.
Original Mortgage
$259,000
Interest Rate
5.58%
Mortgage Type
Future Advance Clause Open End Mortgage
Create a Home Valuation Report for This Property
The Home Valuation Report is an in-depth analysis detailing your home's value as well as a comparison with similar homes in the area
Home Values in the Area
Average Home Value in this Area
Purchase History
| Date | Buyer | Sale Price | Title Company |
|---|---|---|---|
| Craney E Brody E | -- | None Available | |
| E Brody Craney And Peggy S Craney Revocable T | -- | None Listed On Document | |
| Craney Edward Brody | -- | American Secure Title Logan | |
| Craney E Brody | -- | Cache Title Company | |
| Craney E Brody | -- | Cache Title Company | |
| Craney E Brody | -- | Northern Title Company |
Source: Public Records
Mortgage History
| Date | Status | Borrower | Loan Amount |
|---|---|---|---|
| Previous Owner | Craney Edward Brody | $258,000 | |
| Previous Owner | Craney E Brody | $275,000 | |
| Previous Owner | Craney E Brody | $259,000 |
Source: Public Records
Tax History Compared to Growth
Tax History
| Year | Tax Paid | Tax Assessment Tax Assessment Total Assessment is a certain percentage of the fair market value that is determined by local assessors to be the total taxable value of land and additions on the property. | Land | Improvement |
|---|---|---|---|---|
| 2025 | $2,193 | $335,035 | $0 | $0 |
| 2024 | $231 | $327,790 | $0 | $0 |
| 2023 | $2,443 | $324,475 | $0 | $0 |
| 2022 | $2,213 | $279,590 | $0 | $0 |
| 2021 | $212 | $411,440 | $88,400 | $323,040 |
| 2020 | $1,965 | $357,600 | $88,400 | $269,200 |
| 2019 | $1,756 | $302,895 | $88,400 | $214,495 |
| 2018 | $1,624 | $270,176 | $88,400 | $181,776 |
| 2017 | $1,494 | $129,635 | $0 | $0 |
| 2016 | $1,519 | $129,635 | $0 | $0 |
| 2015 | $1,521 | $129,635 | $0 | $0 |
| 2014 | $1,453 | $127,185 | $0 | $0 |
| 2013 | -- | $127,185 | $0 | $0 |
Source: Public Records
Map
Nearby Homes