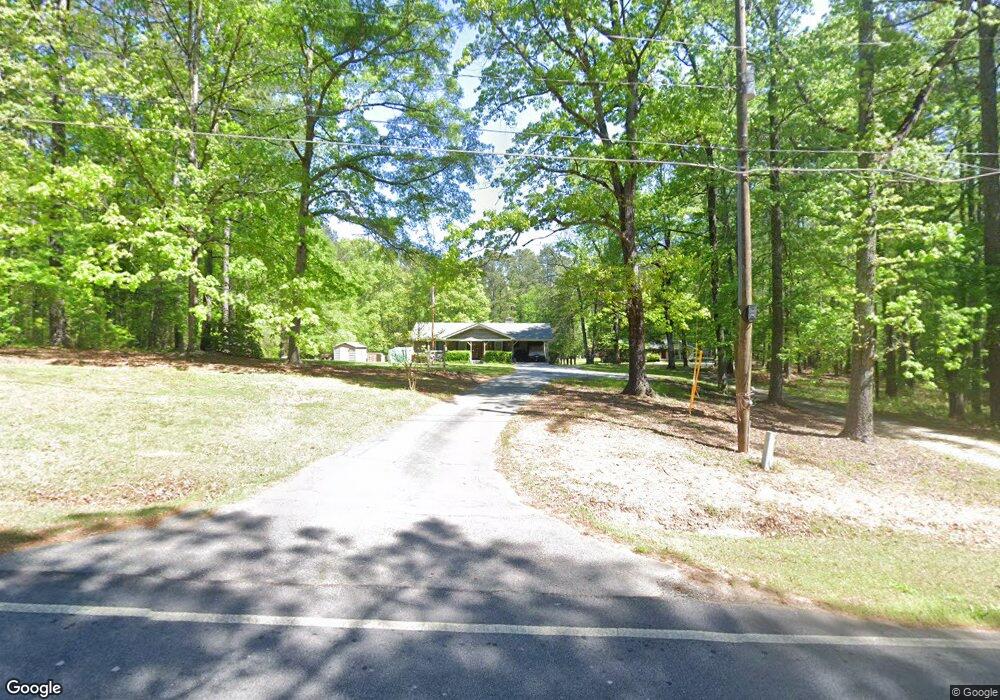
768 School Rd Hampton, GA 30228
Spalding County NeighborhoodEstimated Value: $157,000 - $236,000
3
Beds
1
Bath
1,155
Sq Ft
$162/Sq Ft
Est. Value
About This Home
This home is located at 768 School Rd, Hampton, GA 30228 and is currently estimated at $187,502, approximately $162 per square foot. 768 School Rd is a home located in Spalding County with nearby schools including Beaverbrook Elementary School, Cowan Road Middle School, and Griffin High School.
Ownership History
Date
Name
Owned For
Owner Type
Purchase Details
Closed on
Feb 7, 2025
Sold by
Bailey Robby Y
Bought by
Lyskowinski Penny and Bailey Robby Y
Current Estimated Value
Home Financials for this Owner
Home Financials are based on the most recent Mortgage that was taken out on this home.
Original Mortgage
$120,000
Outstanding Balance
$112,127
Interest Rate
6.95%
Mortgage Type
New Conventional
Estimated Equity
$75,375
Purchase Details
Closed on
May 25, 1990
Sold by
Smith Gerald Keith
Bought by
Bailey Robby Y and Bailey Stacey J
Purchase Details
Closed on
May 23, 1986
Sold by
Doyle Donald T and Doyle Wanda D
Bought by
Smith Gerald Keith
Purchase Details
Closed on
Apr 26, 1979
Sold by
Dees Billy and Dees Jeanette
Bought by
Doyle Donald T and Doyle Wanda D
Purchase Details
Closed on
Jul 30, 1974
Sold by
Smith Frank E
Bought by
Dees Billy and Dees Jeanette
Create a Home Valuation Report for This Property
The Home Valuation Report is an in-depth analysis detailing your home's value as well as a comparison with similar homes in the area
Home Values in the Area
Average Home Value in this Area
Purchase History
| Date | Buyer | Sale Price | Title Company |
|---|---|---|---|
| Lyskowinski Penny | -- | -- | |
| Bailey Robby Y | $48,500 | -- | |
| Smith Gerald Keith | $14,500 | -- | |
| Doyle Donald T | $31,300 | -- | |
| Dees Billy | -- | -- | |
| Dees Billy | -- | -- |
Source: Public Records
Mortgage History
| Date | Status | Borrower | Loan Amount |
|---|---|---|---|
| Open | Lyskowinski Penny | $120,000 |
Source: Public Records
Tax History
| Year | Tax Paid | Tax Assessment Tax Assessment Total Assessment is a certain percentage of the fair market value that is determined by local assessors to be the total taxable value of land and additions on the property. | Land | Improvement |
|---|---|---|---|---|
| 2025 | $1,618 | $45,236 | $12,800 | $32,436 |
| 2024 | $1,601 | $45,236 | $12,800 | $32,436 |
| 2023 | $1,618 | $42,652 | $12,800 | $29,852 |
| 2022 | $1,211 | $33,308 | $10,400 | $22,908 |
| 2021 | $1,084 | $29,801 | $10,400 | $19,401 |
| 2020 | $1,087 | $29,801 | $10,400 | $19,401 |
| 2019 | $1,109 | $29,801 | $10,400 | $19,401 |
| 2018 | $1,073 | $28,068 | $10,400 | $17,668 |
| 2017 | $1,043 | $28,068 | $10,400 | $17,668 |
| 2016 | $1,062 | $28,068 | $10,400 | $17,668 |
| 2015 | $1,094 | $28,068 | $10,400 | $17,668 |
| 2014 | $1,116 | $28,068 | $10,400 | $17,668 |
Source: Public Records
Map
Nearby Homes
- 1690 Patterson Rd
- 2987 Steele Rd
- 348 School Rd
- 166 Evans Rd
- 466 & 472 Minter Dr
- 0 Elder Rd Unit 25075151
- 0 Elder Rd Unit 10619475
- 1100 Patterson Rd
- 1060 Patterson Rd
- 11899 Conrad Cir
- 175 Mobley Rd
- 215 Mobley Rd
- 3330 Highway 3 N
- 110 Fannin Rd
- 4454 Georgia Highway 3
- 295 Hillview Rd
- 1980 Kilgore Rd
- 103 Hammond Rd
- 114 Woodcrest Dr
- 1100 Stiles Crossing Unit 41
Your Personal Tour Guide
Ask me questions while you tour the home.