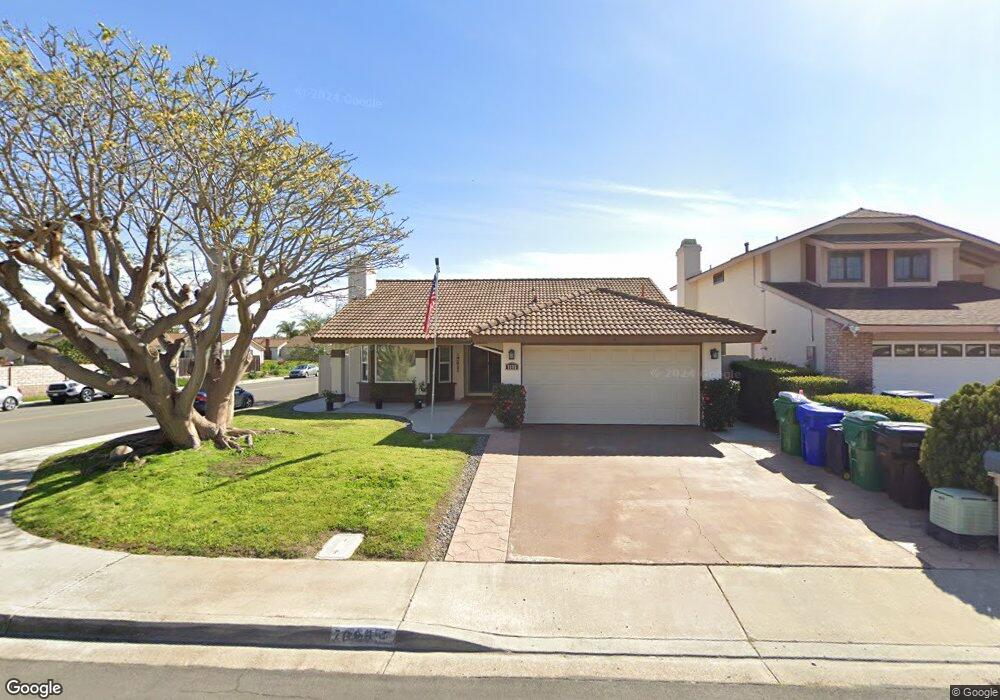
7685 Canyon Point Ln San Diego, CA 92126
Mira Mesa NeighborhoodEstimated Value: $1,079,240 - $1,283,000
3
Beds
2
Baths
1,396
Sq Ft
$833/Sq Ft
Est. Value
About This Home
This home is located at 7685 Canyon Point Ln, San Diego, CA 92126 and is currently estimated at $1,163,310, approximately $833 per square foot. 7685 Canyon Point Ln is a home located in San Diego County with nearby schools including Hickman Elementary School, Challenger Middle School, and Mira Mesa High School.
Ownership History
Date
Name
Owned For
Owner Type
Purchase Details
Closed on
Mar 28, 2014
Sold by
Spencer Michael A and Spencer Jennifer A
Bought by
Spencer Michael A and Spencer Jennifer A
Current Estimated Value
Home Financials for this Owner
Home Financials are based on the most recent Mortgage that was taken out on this home.
Original Mortgage
$367,750
Outstanding Balance
$278,926
Interest Rate
4.28%
Mortgage Type
New Conventional
Estimated Equity
$884,384
Purchase Details
Closed on
Feb 15, 2012
Sold by
Curran Patricia J
Bought by
Spencer Michael A and Ruark Jennifer A
Home Financials for this Owner
Home Financials are based on the most recent Mortgage that was taken out on this home.
Original Mortgage
$374,205
Interest Rate
3.83%
Mortgage Type
FHA
Purchase Details
Closed on
Nov 29, 2004
Sold by
Curran Patricia J
Bought by
Curran Patricia J
Purchase Details
Closed on
Dec 16, 2003
Sold by
Curran Henry S
Bought by
Curran Henry S
Purchase Details
Closed on
Sep 16, 1987
Purchase Details
Closed on
Apr 6, 1983
Create a Home Valuation Report for This Property
The Home Valuation Report is an in-depth analysis detailing your home's value as well as a comparison with similar homes in the area
Home Values in the Area
Average Home Value in this Area
Purchase History
| Date | Buyer | Sale Price | Title Company |
|---|---|---|---|
| Spencer Michael A | -- | Lawyers Title | |
| Spencer Michael A | $390,000 | First American Title San Die | |
| Curran Patricia J | -- | -- | |
| Curran Henry S | -- | -- | |
| -- | $149,500 | -- | |
| -- | $102,400 | -- |
Source: Public Records
Mortgage History
| Date | Status | Borrower | Loan Amount |
|---|---|---|---|
| Open | Spencer Michael A | $367,750 | |
| Closed | Spencer Michael A | $374,205 |
Source: Public Records
Tax History Compared to Growth
Tax History
| Year | Tax Paid | Tax Assessment Tax Assessment Total Assessment is a certain percentage of the fair market value that is determined by local assessors to be the total taxable value of land and additions on the property. | Land | Improvement |
|---|---|---|---|---|
| 2025 | $5,865 | $489,849 | $326,569 | $163,280 |
| 2024 | $5,865 | $480,245 | $320,166 | $160,079 |
| 2023 | $5,733 | $470,830 | $313,889 | $156,941 |
| 2022 | $5,578 | $461,599 | $307,735 | $153,864 |
| 2021 | $5,538 | $452,549 | $301,701 | $150,848 |
| 2020 | $5,470 | $447,910 | $298,608 | $149,302 |
| 2019 | $5,370 | $439,128 | $292,753 | $146,375 |
| 2018 | $5,021 | $430,518 | $287,013 | $143,505 |
| 2017 | $4,897 | $422,078 | $281,386 | $140,692 |
| 2016 | $4,817 | $413,803 | $275,869 | $137,934 |
| 2015 | $4,745 | $407,589 | $271,726 | $135,863 |
| 2014 | $4,669 | $399,606 | $266,404 | $133,202 |
Source: Public Records
Map
Nearby Homes
- 7561 Windsong Rd
- 7646 Acama St
- 7636 Acama St
- 7736 Alcamo Rd
- 8007 New Salem St
- 11545 Caminito la Bar Unit 74
- 7387 New Salem St
- 11149 Blythe Rd
- 7758 Prairie Shadow Rd
- 7444 Mason Heights Ln
- 7385 Calle Cristobal Unit 225
- 10840 New Salem Point
- 11530 Caminito la Bar Unit 132
- 7365 Calle Cristobal Unit 197
- 7349 Calle Cristobal Unit 181
- 8054 Los Sabalos St
- 10948 Worthing Ave
- 10840 Deering St
- 11305 Avenida Del Gato
- 11329 Avenida Del Gato
- 7675 Canyon Point Ln
- 7692 Parma Ln
- 7665 Canyon Point Ln
- 7684 Parma Ln
- 7705 Canyon Point Ln
- 7676 Parma Ln
- 7696 Canyon Point Ln
- 7655 Canyon Point Ln
- 7686 Canyon Point Ln
- 7712 Parma Ln
- 7706 Canyon Point Ln
- 7711 Canyon Point Ln
- 7668 Parma Ln
- 7666 Canyon Point Ln
- 11054 Canyon Point Ct
- 7645 Canyon Point Ln
- 7722 Parma Ln
- 7717 Canyon Point Ln
- 7660 Parma Ln
- 7676 Canyon Point Ln