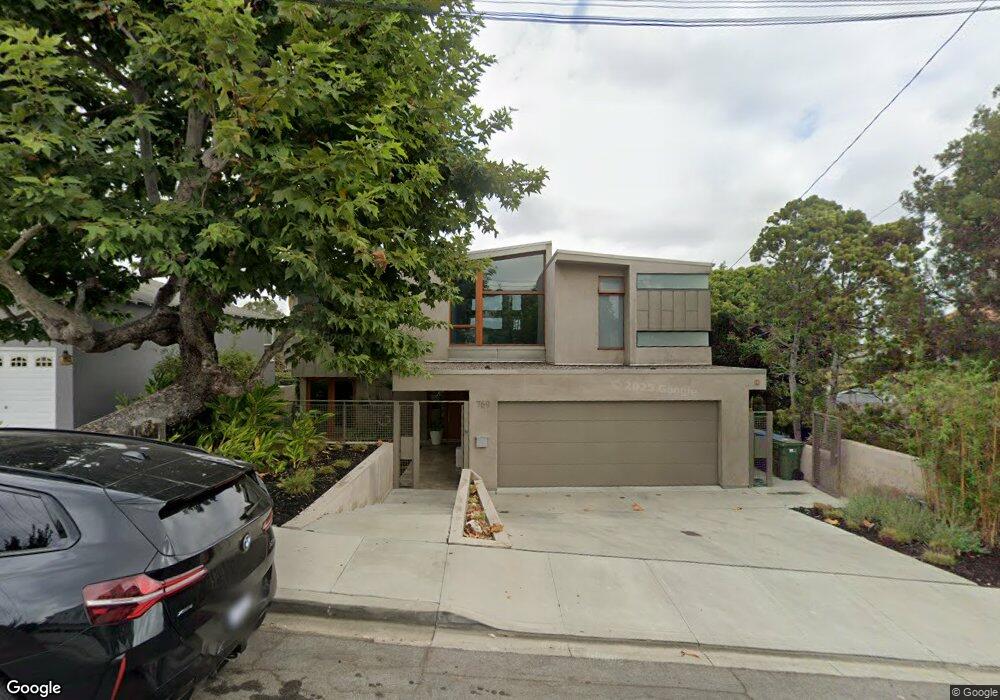
769 27th St Manhattan Beach, CA 90266
Estimated Value: $4,020,141 - $5,546,000
3
Beds
5
Baths
4,131
Sq Ft
$1,133/Sq Ft
Est. Value
About This Home
This home is located at 769 27th St, Manhattan Beach, CA 90266 and is currently estimated at $4,681,535, approximately $1,133 per square foot. 769 27th St is a home located in Los Angeles County with nearby schools including Grand View Elementary School, Manhattan Beach Middle School, and Mira Costa High School.
Ownership History
Date
Name
Owned For
Owner Type
Purchase Details
Closed on
Sep 14, 2009
Sold by
Kunianski Samuel Morris and Sikora Marcia Jo
Bought by
Kunianski Samuel Morris
Current Estimated Value
Purchase Details
Closed on
Apr 3, 2001
Sold by
Kunianski Samuel Morris and Sikora Marcia Jo
Bought by
Kunianski Samuel Morris
Purchase Details
Closed on
Apr 29, 1994
Sold by
Heathcote Douglas M and Heathcote Alice A
Bought by
Kunianski Sam
Create a Home Valuation Report for This Property
The Home Valuation Report is an in-depth analysis detailing your home's value as well as a comparison with similar homes in the area
Home Values in the Area
Average Home Value in this Area
Purchase History
| Date | Buyer | Sale Price | Title Company |
|---|---|---|---|
| Kunianski Samuel Morris | -- | First American Title | |
| Kunianski Samuel Morris | -- | -- | |
| Kunianski Samuel Morris | -- | -- | |
| Kunianski Sam | $445,500 | Title Land Company |
Source: Public Records
Tax History
| Year | Tax Paid | Tax Assessment Tax Assessment Total Assessment is a certain percentage of the fair market value that is determined by local assessors to be the total taxable value of land and additions on the property. | Land | Improvement |
|---|---|---|---|---|
| 2025 | $16,012 | $1,389,341 | $605,761 | $783,580 |
| 2024 | $16,012 | $1,362,100 | $593,884 | $768,216 |
| 2023 | $15,529 | $1,335,393 | $582,240 | $753,153 |
| 2022 | $15,263 | $1,309,210 | $570,824 | $738,386 |
| 2021 | $15,009 | $1,283,540 | $559,632 | $723,908 |
| 2019 | $14,610 | $1,245,472 | $543,034 | $702,438 |
| 2018 | $14,280 | $1,221,052 | $532,387 | $688,665 |
| 2016 | $13,174 | $1,173,639 | $511,715 | $661,924 |
| 2015 | $12,903 | $1,156,011 | $504,029 | $651,982 |
| 2014 | $12,728 | $1,133,367 | $494,156 | $639,211 |
Source: Public Records
Map
Nearby Homes
- 2623 Laurel Ave
- 3013 Maple Ave
- 2205 Pacific Ave
- 2917 N Poinsettia Ave
- 2921 N Poinsettia Ave
- 2100 Palm Ave
- 612 33rd St
- 3508 Maple Ave
- 2508 Pine Ave
- 3604 Laurel Ave
- 592 33rd St
- 3619 Laurel Ave
- 2317 Elm Ave
- 1801 Pine Ave
- 425 23rd Place
- 947 Manhattan Beach
- 844 14th St
- 1801 Oak Ave
- 966 Rosecrans Ave
- 2215 Alma Ave
Your Personal Tour Guide
Ask me questions while you tour the home.