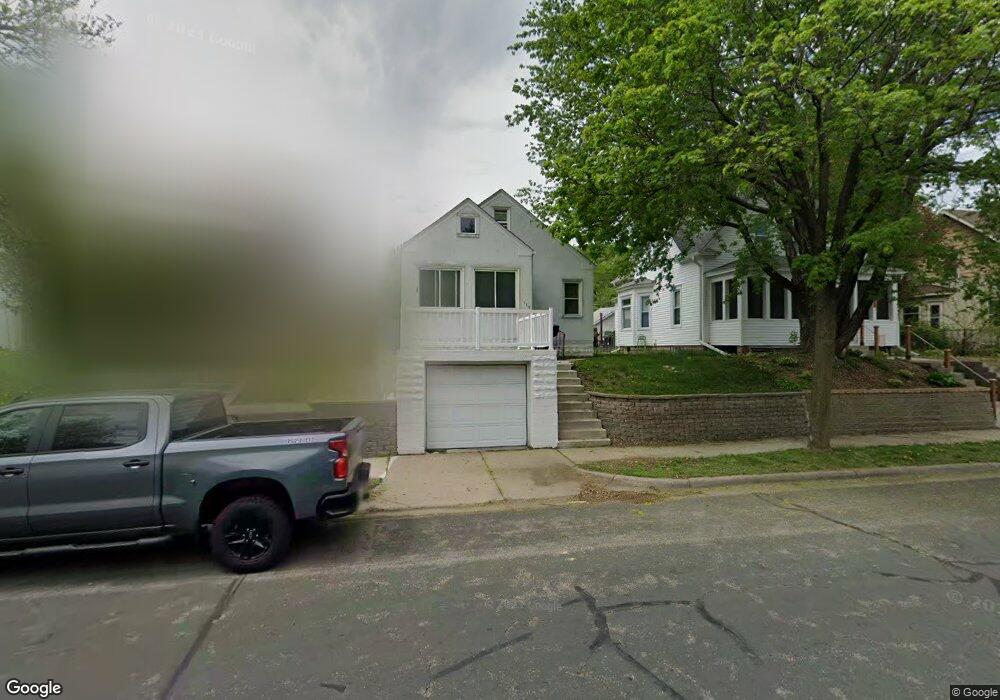
769 769 15th-Avenue-n South St. Paul, MN 55075
Estimated Value: $277,713 - $302,000
3
Beds
2
Baths
1,082
Sq Ft
$272/Sq Ft
Est. Value
About This Home
This home is located at 769 769 15th-Avenue-n, South St. Paul, MN 55075 and is currently estimated at $293,928, approximately $271 per square foot. 769 769 15th-Avenue-n is a home located in Dakota County with nearby schools including Lincoln Center Elementary, South St. Paul Secondary, and Academic Arts High School.
Ownership History
Date
Name
Owned For
Owner Type
Purchase Details
Closed on
Sep 30, 2016
Sold by
Kvilhaug Thomas J and Kvilhaug Bria J
Bought by
Wildt Jordan D and Kissel Margaret J
Current Estimated Value
Home Financials for this Owner
Home Financials are based on the most recent Mortgage that was taken out on this home.
Original Mortgage
$168,150
Interest Rate
4.2%
Mortgage Type
New Conventional
Purchase Details
Closed on
Nov 30, 2012
Sold by
Pearce Matthew B and Pearce Sara A
Bought by
Kvilhaug Thomas J
Home Financials for this Owner
Home Financials are based on the most recent Mortgage that was taken out on this home.
Original Mortgage
$121,700
Interest Rate
3.25%
Mortgage Type
FHA
Purchase Details
Closed on
Jun 29, 2001
Sold by
Sturm Barbara A
Bought by
Pearce Sara A and Williamson Ronn E
Create a Home Valuation Report for This Property
The Home Valuation Report is an in-depth analysis detailing your home's value as well as a comparison with similar homes in the area
Home Values in the Area
Average Home Value in this Area
Purchase History
| Date | Buyer | Sale Price | Title Company |
|---|---|---|---|
| Wildt Jordan D | $177,000 | First American Title Co | |
| Kvilhaug Thomas J | $124,000 | Liberty Title | |
| Pearce Sara A | $129,900 | -- |
Source: Public Records
Mortgage History
| Date | Status | Borrower | Loan Amount |
|---|---|---|---|
| Previous Owner | Wildt Jordan D | $168,150 | |
| Previous Owner | Kvilhaug Thomas J | $121,700 |
Source: Public Records
Tax History Compared to Growth
Tax History
| Year | Tax Paid | Tax Assessment Tax Assessment Total Assessment is a certain percentage of the fair market value that is determined by local assessors to be the total taxable value of land and additions on the property. | Land | Improvement |
|---|---|---|---|---|
| 2024 | $3,250 | $253,700 | $61,000 | $192,700 |
| 2023 | $3,250 | $244,400 | $61,400 | $183,000 |
| 2022 | $2,642 | $240,500 | $61,300 | $179,200 |
| 2021 | $2,514 | $206,100 | $53,300 | $152,800 |
| 2020 | $2,408 | $194,000 | $50,800 | $143,200 |
| 2019 | $2,197 | $191,100 | $48,400 | $142,700 |
| 2018 | $2,129 | $170,400 | $43,000 | $127,400 |
| 2017 | $1,774 | $159,900 | $41,000 | $118,900 |
| 2016 | $1,949 | $141,100 | $37,200 | $103,900 |
| 2015 | $1,711 | $115,033 | $29,232 | $85,801 |
| 2014 | -- | $113,834 | $29,157 | $84,677 |
| 2013 | -- | $96,285 | $24,523 | $71,762 |
Source: Public Records
Map
Nearby Homes
- 818 16th Ave N
- 934 15th Ave N
- 921 17th Ave N
- 606 13th Ave N
- 522 16th Ave N
- 1010 Summit Ave
- 1200 Dwane St
- 1044 17th Ave N
- 436 17th Ave N
- 425 16th Ave N
- 601 Levander Way Unit 101
- 601 Levander Way Unit 208
- 518 8th Ave N
- 352 12th Ave N
- 916 4th St N
- 2205 Acorn Ln
- 1365 Christensen Ave
- 212 11th Ave N
- 126 20th Ave N
- 114 20th Ave N
- 769 769 15th Ave N
- 769 15th Ave N
- 763 15th Ave N
- 771 15th Ave N
- 761 15th Ave N
- 761 761 15th Ave N
- 775 15th Ave N
- 755 15th Ave N
- 766 16th Ave N
- 762 16th Ave N
- 770 16th Ave N
- 758 16th Ave N
- 774 16th Ave N
- 768 15th Ave N
- 752 16th Ave N
- 752 16th Ave N Unit 754
- 770 15th Ave N
- 776 16th Ave N
- 754 16th Ave N
- 766 15th Ave N