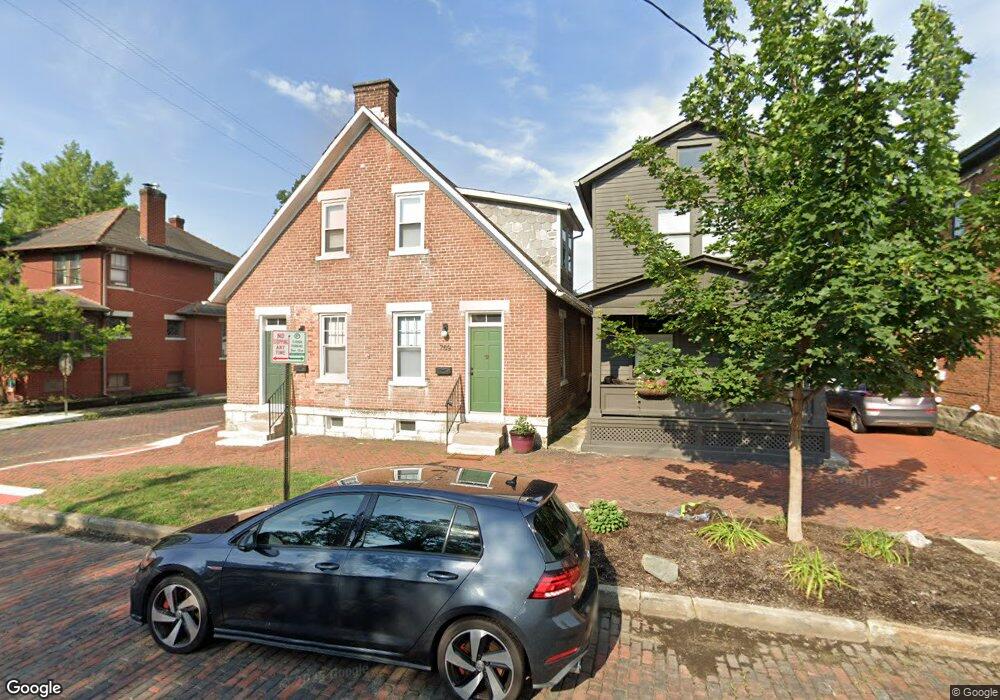
769 Mohawk St Unit 771 Columbus, OH 43206
German Village NeighborhoodEstimated Value: $456,409 - $707,000
2
Beds
2
Baths
1,450
Sq Ft
$379/Sq Ft
Est. Value
About This Home
This home is located at 769 Mohawk St Unit 771, Columbus, OH 43206 and is currently estimated at $549,352, approximately $378 per square foot. 769 Mohawk St Unit 771 is a home located in Franklin County with nearby schools including Stewart Alternative Elementary School @ Beck Elementary School, South High School, and South Columbus Preparatory Academy.
Ownership History
Date
Name
Owned For
Owner Type
Purchase Details
Closed on
Sep 12, 2024
Sold by
769-771 Mohawk St Llc
Bought by
Nafiu Olubukola and Nafiu Iquo
Current Estimated Value
Home Financials for this Owner
Home Financials are based on the most recent Mortgage that was taken out on this home.
Original Mortgage
$330,960
Outstanding Balance
$327,240
Interest Rate
6.47%
Mortgage Type
New Conventional
Estimated Equity
$222,112
Purchase Details
Closed on
Mar 1, 1999
Sold by
Wippel Ralph
Bought by
Gross Thomas R and Gross Nancy
Purchase Details
Closed on
Feb 8, 1999
Sold by
Wippel Paul E and Wippel Helen L
Bought by
Wippel Ralph and The Wippel Charitable Remainder Trust
Purchase Details
Closed on
Mar 16, 1998
Sold by
Wippel Paul E and Wippel Helen L
Bought by
Wippel Paul E and Wippel Helen L
Purchase Details
Closed on
Jun 1, 1983
Create a Home Valuation Report for This Property
The Home Valuation Report is an in-depth analysis detailing your home's value as well as a comparison with similar homes in the area
Home Values in the Area
Average Home Value in this Area
Purchase History
| Date | Buyer | Sale Price | Title Company |
|---|---|---|---|
| Nafiu Olubukola | $472,800 | Stewart Title Company | |
| Gross Thomas R | $150,000 | Amerititle Agency Inc | |
| Wippel Ralph | -- | -- | |
| Wippel Paul E | -- | -- | |
| -- | $80,000 | -- |
Source: Public Records
Mortgage History
| Date | Status | Borrower | Loan Amount |
|---|---|---|---|
| Open | Nafiu Olubukola | $330,960 |
Source: Public Records
Tax History Compared to Growth
Tax History
| Year | Tax Paid | Tax Assessment Tax Assessment Total Assessment is a certain percentage of the fair market value that is determined by local assessors to be the total taxable value of land and additions on the property. | Land | Improvement |
|---|---|---|---|---|
| 2024 | $8,572 | $187,050 | $104,270 | $82,780 |
| 2023 | $8,678 | $187,050 | $104,270 | $82,780 |
| 2022 | $7,554 | $142,140 | $40,710 | $101,430 |
| 2021 | $7,906 | $142,140 | $40,710 | $101,430 |
| 2020 | $7,578 | $142,140 | $40,710 | $101,430 |
| 2019 | $7,785 | $125,200 | $35,390 | $89,810 |
| 2018 | $3,886 | $125,200 | $35,390 | $89,810 |
| 2017 | $7,783 | $125,200 | $35,390 | $89,810 |
| 2016 | $6,456 | $95,030 | $27,160 | $67,870 |
| 2015 | $2,939 | $95,030 | $27,160 | $67,870 |
| 2014 | $5,892 | $95,030 | $27,160 | $67,870 |
| 2013 | $2,768 | $90,510 | $25,865 | $64,645 |
Source: Public Records
Map
Nearby Homes
- 783 Mohawk St
- 745 Mohawk St
- 717 S 3rd St
- 136 E Whittier St
- 688 S 5th St
- 46 E Frankfort St
- 133 E Sycamore St
- 33 E Frankfort St
- 145 E Sycamore St
- 842 S Pearl St
- 25 E Frankfort St
- 649 S 5th St
- 243 E Whittier St Unit 245
- 278 E Sycamore St
- 874 S High St
- 320 E Columbus St
- 307 E Sycamore St
- 606 Rader Alley
- 707 Sycamore Place Unit 707
- 41 W Frankfort St
- 769-771 Mohawk St
- 767 Mohawk St
- 763 Mohawk St
- 779 Mohawk St
- 143 E Columbus St
- 753 Mohawk St
- 780 S Lazelle St
- 787 Mohawk St
- 791 Mohawk St
- 770 Mohawk St Unit 772
- 754 S Lazelle St
- 766 Mohawk St
- 795B Mohawk St
- 795A Mohawk St
- 795 Mohawk St
- 795 Mohawk St Unit B
- 795 Mohawk St Unit A
- 795 Mohawk St Unit 795 B 2nd Flr
- 795 Mohawk St Unit 795A
- 795 Mohawk St Unit 795B