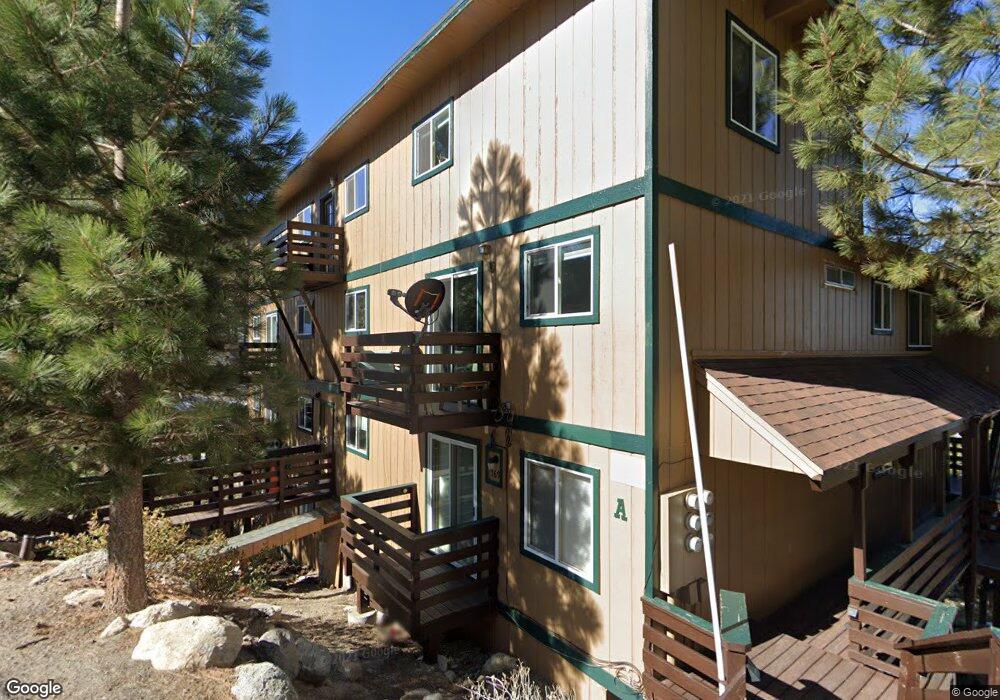
769 N Bowl Stateline, NV 89449
Estimated Value: $762,887 - $875,000
3
Beds
2
Baths
1,239
Sq Ft
$664/Sq Ft
Est. Value
About This Home
This home is located at 769 N Bowl, Stateline, NV 89449 and is currently estimated at $822,222, approximately $663 per square foot. 769 N Bowl is a home located in Douglas County with nearby schools including Gene Scarselli Elementary School, Pau Wa Lu Middle School, and Douglas County High School.
Ownership History
Date
Name
Owned For
Owner Type
Purchase Details
Closed on
Aug 17, 2022
Sold by
Hodgkins and Anna
Bought by
Hodgkins Family Trust
Current Estimated Value
Purchase Details
Closed on
Aug 3, 2017
Sold by
Kaplan Steven
Bought by
Hodgkins Aaron and Balan Hodgkins Anna
Home Financials for this Owner
Home Financials are based on the most recent Mortgage that was taken out on this home.
Original Mortgage
$299,600
Interest Rate
3.9%
Mortgage Type
New Conventional
Purchase Details
Closed on
Oct 9, 2012
Sold by
Kaplan Steven
Bought by
Kaplan Wendy
Purchase Details
Closed on
Sep 24, 2012
Sold by
Nelson Jearl J and Nelson Mitzi J
Bought by
Kaplan Steven and Kaplan Family Trust
Purchase Details
Closed on
Dec 17, 2009
Sold by
Willis Patrick K
Bought by
Nelson Jearl J and Nelson Mitzi J
Create a Home Valuation Report for This Property
The Home Valuation Report is an in-depth analysis detailing your home's value as well as a comparison with similar homes in the area
Home Values in the Area
Average Home Value in this Area
Purchase History
| Date | Buyer | Sale Price | Title Company |
|---|---|---|---|
| Hodgkins Family Trust | -- | None Listed On Document | |
| Hodgkins Aaron | $428,000 | First Centennial Title Compa | |
| Kaplan Wendy | -- | Northern Nevada Title | |
| Kaplan Steven | $285,000 | Northern Nevada Title | |
| Nelson Jearl J | $350,000 | First Americantitle Stat |
Source: Public Records
Mortgage History
| Date | Status | Borrower | Loan Amount |
|---|---|---|---|
| Previous Owner | Hodgkins Aaron | $299,600 |
Source: Public Records
Tax History Compared to Growth
Tax History
| Year | Tax Paid | Tax Assessment Tax Assessment Total Assessment is a certain percentage of the fair market value that is determined by local assessors to be the total taxable value of land and additions on the property. | Land | Improvement |
|---|---|---|---|---|
| 2025 | $1,833 | $69,638 | $47,250 | $22,388 |
| 2024 | $1,709 | $70,984 | $47,250 | $23,734 |
| 2023 | $1,709 | $68,346 | $47,250 | $21,096 |
| 2022 | $1,574 | $64,484 | $43,750 | $20,734 |
| 2021 | $1,458 | $60,523 | $40,250 | $20,273 |
| 2020 | $1,410 | $60,582 | $40,250 | $20,332 |
| 2019 | $1,360 | $56,831 | $36,575 | $20,256 |
| 2018 | $1,297 | $53,344 | $33,250 | $20,094 |
| 2017 | $1,261 | $53,614 | $33,250 | $20,364 |
| 2016 | $1,229 | $44,182 | $22,750 | $21,432 |
| 2015 | $1,222 | $44,182 | $22,750 | $21,432 |
| 2014 | $1,182 | $39,364 | $21,000 | $18,364 |
Source: Public Records
Map
Nearby Homes
- 771 N Bowl Unit B
- 416 Quaking Aspen Ln Unit P
- 383 Tramway Dr Unit B
- 761 Milky Way Ct Unit 1
- 363 Tramway Dr
- 758 Milky Way Ct Unit H
- 331 Tramway Dr Unit 10
- 331 Tramway Dr Unit 4
- 331 Tramway Dr Unit 13
- 323 Tramway Dr Unit 207
- 323 Tramway Dr Unit 301
- 323 Tramway Dr Unit 407
- 323 Tramway Dr Unit 202
- 323 Tramway Dr Unit 306
- 323 Tramway Dr Unit 308
- 313 Tramway Dr Unit 20
- 313 Tramway Dr Unit 8
- 305 Galaxy Ln Unit 5
- 305 Galaxy Ln Unit 3
- 305 Galaxy Ln Unit 2
- 769 N Bowl Unit B
- 769 N Bowl Unit E
- 769 N Bowl Unit F
- 769 N Bowl Unit A
- 769 N Bowl Unit C
- 769 Bowles Ln Unit D
- 769 Bowles Ln Unit E
- 769 Bowles Ln Unit F
- 769 Bowles Ln Unit C
- 769 Bowles Ln Unit B
- 769 Bowles Ln Unit A
- 771 N Bowl
- 771 N Bowl Unit c
- 771 N Bowl
- 771 N Bowl Unit 771 D
- 771 Bowles Ln Unit B
- 771 Bowles Ln Unit C
- 771 Bowles Ln Unit D
- 771 Bowles Ln Unit A
- 771 Bowles Ln Unit H