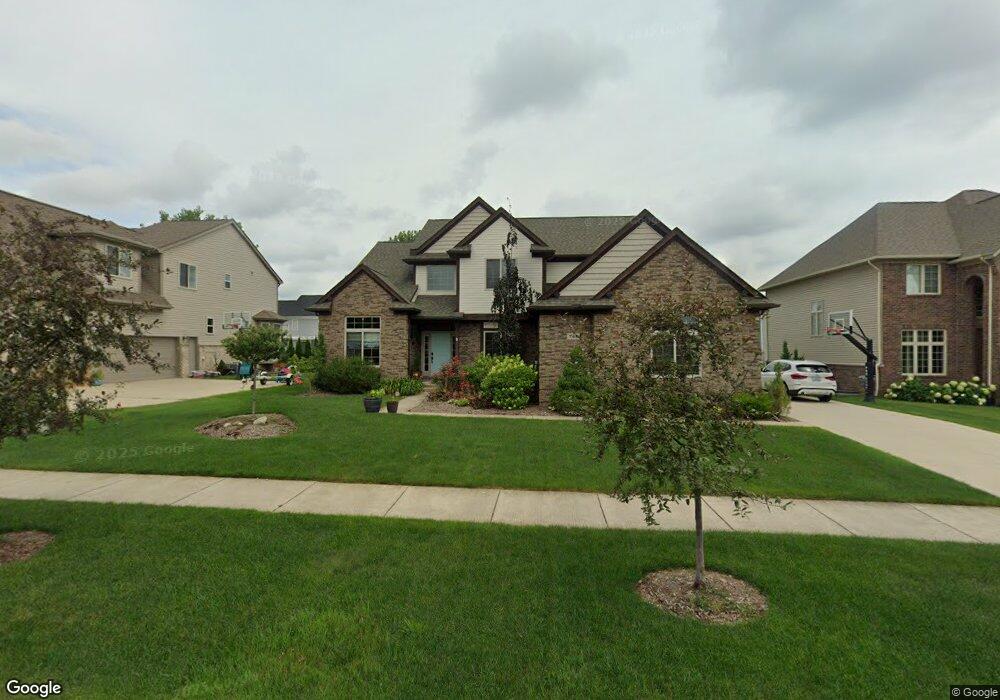
769 Pineridge Ave Oxford, MI 48371
Estimated Value: $548,923 - $577,000
4
Beds
3
Baths
2,700
Sq Ft
$210/Sq Ft
Est. Value
About This Home
This home is located at 769 Pineridge Ave, Oxford, MI 48371 and is currently estimated at $565,981, approximately $209 per square foot. 769 Pineridge Ave is a home located in Oakland County with nearby schools including Oxford Elementary School, Daniel Axford Elementary School, and Oxford Middle School.
Ownership History
Date
Name
Owned For
Owner Type
Purchase Details
Closed on
Jun 16, 2020
Sold by
Bridges Timothy M and Bridges Melissa A
Bought by
Alonso Ruben
Current Estimated Value
Home Financials for this Owner
Home Financials are based on the most recent Mortgage that was taken out on this home.
Original Mortgage
$337,565
Outstanding Balance
$298,662
Interest Rate
3.1%
Mortgage Type
FHA
Estimated Equity
$267,319
Purchase Details
Closed on
Oct 30, 2014
Sold by
Asa Construction Inc
Bought by
Bridges Timothy M and Bridges Melissa A
Purchase Details
Closed on
Dec 6, 2012
Sold by
Kenny Thomas A
Bought by
Noble Thomas E
Purchase Details
Closed on
Dec 22, 2008
Sold by
Dimaria Homes & Associates Inc
Bought by
Lake Orion Group Llc
Purchase Details
Closed on
Jan 13, 2005
Sold by
Westlake Of Waterstone Llc
Bought by
Dimaria Homes Inc
Create a Home Valuation Report for This Property
The Home Valuation Report is an in-depth analysis detailing your home's value as well as a comparison with similar homes in the area
Home Values in the Area
Average Home Value in this Area
Purchase History
| Date | Buyer | Sale Price | Title Company |
|---|---|---|---|
| Alonso Ruben | $370,000 | Fidelity National Title | |
| Bridges Timothy M | $300,000 | Seaver Title Agency | |
| Asa Construction Inc | -- | None Available | |
| Noble Thomas E | $79,500 | Liberty Title | |
| Noble & Assoc Llc | -- | Liberty Title | |
| Lake Orion Group Llc | $400,000 | Greco | |
| Dimaria Homes & Associates Inc | -- | Greco | |
| Dimaria Homes Inc | $2,810,000 | Visionary Title Agency Llc |
Source: Public Records
Mortgage History
| Date | Status | Borrower | Loan Amount |
|---|---|---|---|
| Open | Alonso Ruben | $337,565 |
Source: Public Records
Tax History Compared to Growth
Tax History
| Year | Tax Paid | Tax Assessment Tax Assessment Total Assessment is a certain percentage of the fair market value that is determined by local assessors to be the total taxable value of land and additions on the property. | Land | Improvement |
|---|---|---|---|---|
| 2024 | $4,256 | $220,820 | $0 | $0 |
| 2023 | $4,059 | $194,200 | $0 | $0 |
| 2022 | $6,281 | $177,080 | $0 | $0 |
| 2021 | $6,004 | $166,150 | $0 | $0 |
| 2020 | $3,376 | $160,750 | $0 | $0 |
| 2019 | $4,934 | $153,410 | $0 | $0 |
| 2018 | $4,840 | $145,090 | $0 | $0 |
| 2017 | $4,614 | $143,880 | $0 | $0 |
| 2016 | $4,604 | $140,520 | $0 | $0 |
| 2015 | -- | $132,820 | $0 | $0 |
| 2014 | -- | $15,180 | $0 | $0 |
| 2011 | -- | $16,870 | $0 | $0 |
Source: Public Records
Map
Nearby Homes
- 822 Westlake Ave
- 1151 Cross St Unit 21
- 720 Marlayna Dr
- 682 Westlake Ave
- 622 Westlake Ave
- 496 Overlook Dr
- 372 Overlook Dr
- 1170 Glass Lake Cir
- 1465 Roy Rd
- 1400 Ora Rd
- 224 Stony Lake Dr Unit 57
- 778 W Peninsula Ct
- 1531 Seymour Lake Rd
- 861 Seymour Lake Rd
- 600 Cornerstone Dr
- 0000 Brauer Rd
- 302 Tanview Dr
- 1858 Sandy Shores Dr
- 1904 Sandy Shores Dr
- 1974 Sandy Shores Dr
- 761 Pineridge Ave
- 761 Pine Ridge Ave
- 777 Pineridge Ave
- 942 Townsend Dr Unit 80
- 768 Pine Ridge Ave
- 932 Townsend Dr Unit 79
- 785 Pine Ridge Ave
- 753 Pine Ridge Ave
- 768 Pineridge Ave
- 764 Pine Ridge Ave
- 950 Townsend Dr
- 754 Pine Ridge Ave
- 912 Townsend Dr Unit 77
- 960 Townsend Dr
- 745 Pine Ridge Ave
- 818 Pine Ridge Ave
- 793 Pine Ridge Ave
- 902 Townsend Dr
- 738 Pine Ridge Ave
- 923 Westlake Ave