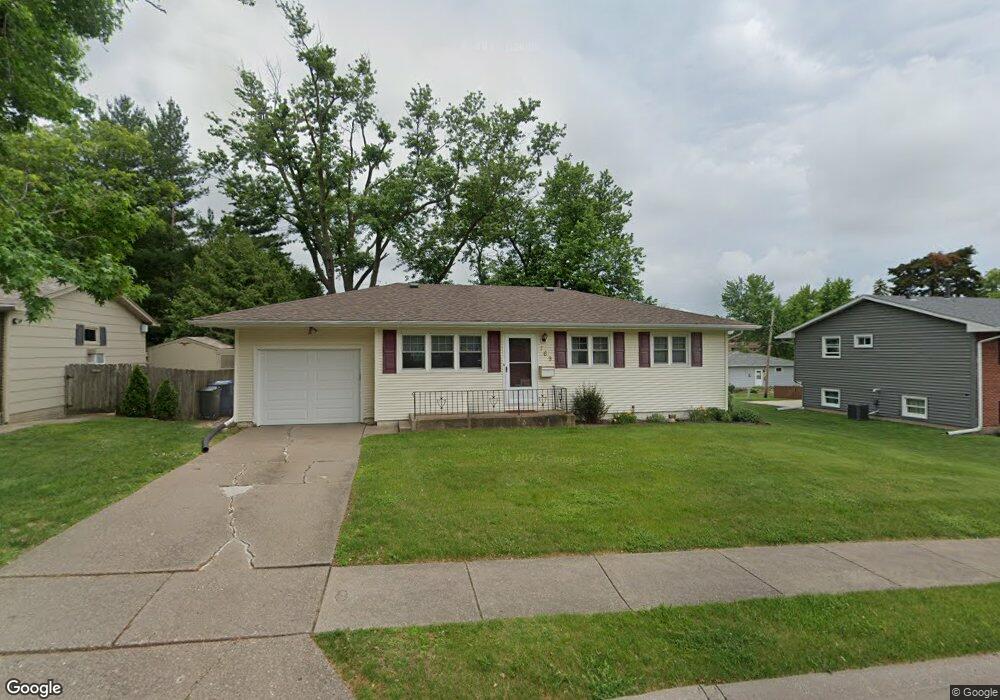
769 W 44th St Davenport, IA 52806
North Side NeighborhoodEstimated Value: $203,000 - $233,000
3
Beds
2
Baths
1,008
Sq Ft
$214/Sq Ft
Est. Value
About This Home
This home is located at 769 W 44th St, Davenport, IA 52806 and is currently estimated at $216,205, approximately $214 per square foot. 769 W 44th St is a home located in Scott County with nearby schools including Cumberland Hall School, Harrison Elementary School, and Academy Of Continuing Education.
Ownership History
Date
Name
Owned For
Owner Type
Purchase Details
Closed on
Jun 15, 2005
Sold by
Mooney Charles R
Bought by
Freeman Diane M
Current Estimated Value
Home Financials for this Owner
Home Financials are based on the most recent Mortgage that was taken out on this home.
Original Mortgage
$19,275
Outstanding Balance
$10,127
Interest Rate
5.86%
Mortgage Type
Stand Alone Second
Estimated Equity
$206,078
Create a Home Valuation Report for This Property
The Home Valuation Report is an in-depth analysis detailing your home's value as well as a comparison with similar homes in the area
Home Values in the Area
Average Home Value in this Area
Purchase History
| Date | Buyer | Sale Price | Title Company |
|---|---|---|---|
| Freeman Diane M | $128,500 | None Available |
Source: Public Records
Mortgage History
| Date | Status | Borrower | Loan Amount |
|---|---|---|---|
| Open | Freeman Diane M | $19,275 | |
| Open | Freeman Diane M | $102,800 |
Source: Public Records
Tax History Compared to Growth
Tax History
| Year | Tax Paid | Tax Assessment Tax Assessment Total Assessment is a certain percentage of the fair market value that is determined by local assessors to be the total taxable value of land and additions on the property. | Land | Improvement |
|---|---|---|---|---|
| 2025 | $2,910 | $191,740 | $32,530 | $159,210 |
| 2024 | $2,834 | $173,010 | $32,530 | $140,480 |
| 2023 | $3,146 | $173,010 | $32,530 | $140,480 |
| 2022 | $3,092 | $156,180 | $23,660 | $132,520 |
| 2021 | $3,092 | $153,050 | $23,660 | $129,390 |
| 2020 | $2,884 | $141,580 | $23,660 | $117,920 |
| 2019 | $2,798 | $133,230 | $23,660 | $109,570 |
| 2018 | $2,620 | $133,230 | $23,660 | $109,570 |
| 2017 | $2,598 | $128,010 | $23,660 | $104,350 |
| 2016 | $2,498 | $122,790 | $0 | $0 |
| 2015 | $2,498 | $123,450 | $0 | $0 |
| 2014 | $2,548 | $123,450 | $0 | $0 |
| 2013 | $2,500 | $0 | $0 | $0 |
| 2012 | -- | $111,940 | $29,670 | $82,270 |
Source: Public Records
Map
Nearby Homes
- 7 Vista Ct
- 4449 Royal Oaks Dr
- 4612 Warren St Unit 5
- 405 Westerfield Rd
- 4804 Northwest Blvd
- 4610 N Ripley St
- 4757 Willow Cir
- 4743 Willow Cir
- 611 Northbrook Dr
- 315 Colony Dr
- 710 Northbrook Dr
- 825 Northbrook Dr
- 4717 N Harrison St
- 4505 Sheridan St
- 4942 Brown St
- 4618 Fillmore Ln
- 1336 W 38th Place
- 1453 W 41st St
- 1344 W 37th St
- 4705 N Sturdevant St