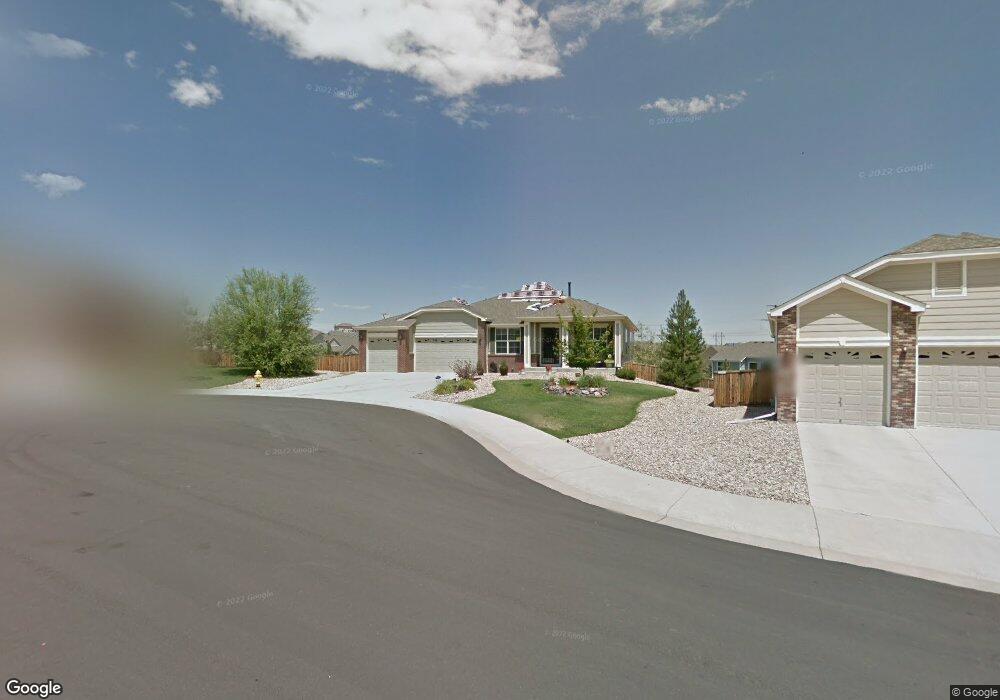
769 Xenon Ln Castle Rock, CO 80108
Sapphire Pointe NeighborhoodEstimated Value: $798,318 - $1,002,000
3
Beds
2
Baths
2,397
Sq Ft
$361/Sq Ft
Est. Value
About This Home
This home is located at 769 Xenon Ln, Castle Rock, CO 80108 and is currently estimated at $864,330, approximately $360 per square foot. 769 Xenon Ln is a home located in Douglas County with nearby schools including Sage Canyon Elementary School, Mesa Middle School, and Douglas County High School.
Ownership History
Date
Name
Owned For
Owner Type
Purchase Details
Closed on
Feb 25, 2017
Sold by
Barry Timothy N
Bought by
Barry Donna E and Barry Donette E
Current Estimated Value
Purchase Details
Closed on
Jun 21, 2016
Sold by
Barry Donna E and Barry Donette E
Bought by
Barry Donna E and Barry Donette E
Purchase Details
Closed on
Aug 9, 2006
Sold by
Kdb Homes Inc
Bought by
Barry Michael D and Barry Donna E
Home Financials for this Owner
Home Financials are based on the most recent Mortgage that was taken out on this home.
Original Mortgage
$409,479
Outstanding Balance
$246,112
Interest Rate
6.78%
Mortgage Type
Unknown
Estimated Equity
$618,218
Create a Home Valuation Report for This Property
The Home Valuation Report is an in-depth analysis detailing your home's value as well as a comparison with similar homes in the area
Home Values in the Area
Average Home Value in this Area
Purchase History
| Date | Buyer | Sale Price | Title Company |
|---|---|---|---|
| Barry Donna E | -- | None Available | |
| Barry Donna E | -- | None Available | |
| Barry Michael D | $431,031 | Fahtco |
Source: Public Records
Mortgage History
| Date | Status | Borrower | Loan Amount |
|---|---|---|---|
| Open | Barry Michael D | $409,479 |
Source: Public Records
Tax History Compared to Growth
Tax History
| Year | Tax Paid | Tax Assessment Tax Assessment Total Assessment is a certain percentage of the fair market value that is determined by local assessors to be the total taxable value of land and additions on the property. | Land | Improvement |
|---|---|---|---|---|
| 2024 | $5,572 | $63,200 | $11,600 | $51,600 |
| 2023 | $5,865 | $63,200 | $11,600 | $51,600 |
| 2022 | $4,242 | $42,580 | $8,220 | $34,360 |
| 2021 | $4,406 | $42,580 | $8,220 | $34,360 |
| 2020 | $4,373 | $42,830 | $7,510 | $35,320 |
| 2019 | $4,386 | $42,830 | $7,510 | $35,320 |
| 2018 | $4,279 | $40,300 | $6,100 | $34,200 |
| 2017 | $4,039 | $40,300 | $6,100 | $34,200 |
| 2016 | $3,975 | $37,160 | $6,000 | $31,160 |
| 2015 | $2,064 | $37,160 | $6,000 | $31,160 |
| 2014 | $2,223 | $34,870 | $4,180 | $30,690 |
Source: Public Records
Map
Nearby Homes
- 7472 Iridium Way
- 7245 Obsidian Ln
- 905 Kryptonite Dr
- 7589 Iridium Ct
- 7408 Sodalite Way
- 7447 Soapstone Way
- 1021 Neptunite Place
- 350 Andromeda Ln
- 7711 Universal Ct
- 7724 Kryptonite Ln
- 6425 Tremolite Dr
- 7108 Sapphire Pointe Blvd
- 1335 Galactic Place
- 1488 Baguette Dr
- 6635 Tremolite Dr
- 7869 Solstice Way
- 7426 Slate Ct
- 857 E Pawnee Trail
- 1289 Diamond Ridge Cir
- 4250 Descent St
- 795 Xenon Ln
- 840 Kryptonite Dr
- 753 Xenon Ln
- 843 Xenon Ln
- 846 Kryptonite Dr
- 7448 Iridium Way
- 7424 Iridium Way
- 858 Kryptonite Dr
- 782 Xenon Ln
- 736 Xenon Ln
- 804 Xenon Ln
- 7400 Iridium Way Unit 4
- 828 Xenon Ln
- 843 Kryptonite Dr
- 860 Xenon Ln
- 7378 Iridium Way
- 855 Kryptonite Dr
- 7419 Iridium Way
- 7508 Iridium Ct
- 7354 Iridium Way