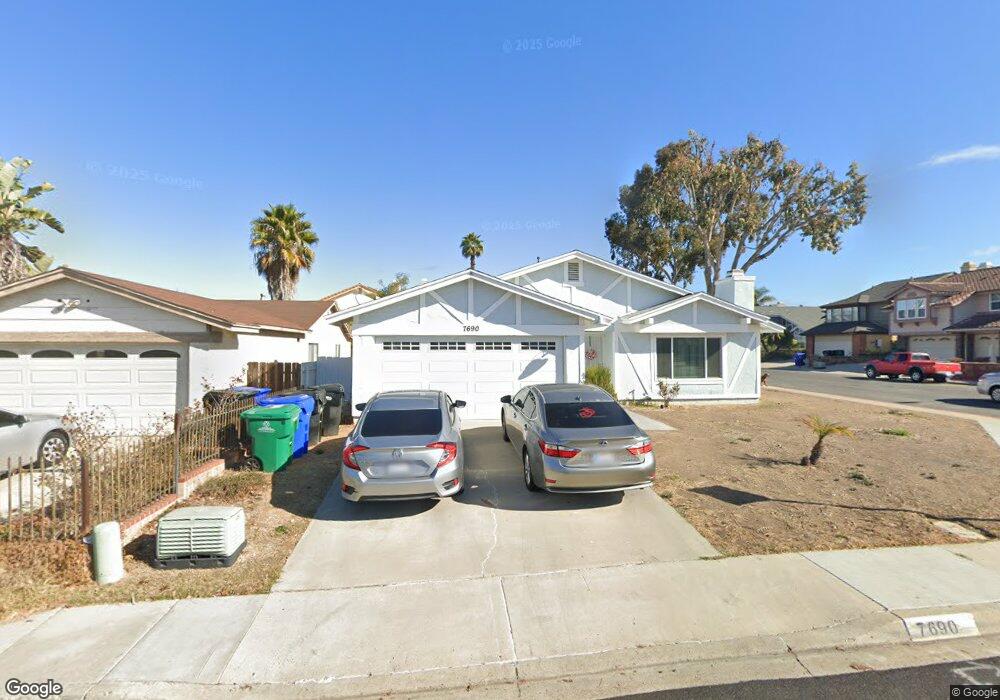
7690 Northrup Dr San Diego, CA 92126
Mira Mesa NeighborhoodEstimated Value: $989,703 - $1,073,000
3
Beds
2
Baths
1,284
Sq Ft
$814/Sq Ft
Est. Value
About This Home
This home is located at 7690 Northrup Dr, San Diego, CA 92126 and is currently estimated at $1,045,426, approximately $814 per square foot. 7690 Northrup Dr is a home located in San Diego County with nearby schools including Jonas Salk Elementary School, Challenger Middle School, and Mira Mesa High School.
Ownership History
Date
Name
Owned For
Owner Type
Purchase Details
Closed on
Mar 11, 2013
Sold by
Nemanich Daniel R
Bought by
Nemanich Daniel R
Current Estimated Value
Home Financials for this Owner
Home Financials are based on the most recent Mortgage that was taken out on this home.
Original Mortgage
$188,800
Outstanding Balance
$132,929
Interest Rate
3.49%
Mortgage Type
New Conventional
Estimated Equity
$912,497
Purchase Details
Closed on
Mar 19, 2004
Sold by
Nemanich Daniel R
Bought by
Nemanich Daniel R
Home Financials for this Owner
Home Financials are based on the most recent Mortgage that was taken out on this home.
Original Mortgage
$220,000
Interest Rate
5.57%
Mortgage Type
New Conventional
Purchase Details
Closed on
Nov 9, 1999
Sold by
Nemanich Daniel R
Bought by
Nemanich Daniel R
Purchase Details
Closed on
Jul 16, 1987
Purchase Details
Closed on
Jun 13, 1986
Purchase Details
Closed on
Dec 19, 1984
Create a Home Valuation Report for This Property
The Home Valuation Report is an in-depth analysis detailing your home's value as well as a comparison with similar homes in the area
Home Values in the Area
Average Home Value in this Area
Purchase History
| Date | Buyer | Sale Price | Title Company |
|---|---|---|---|
| Nemanich Daniel R | -- | Lsi | |
| Nemanich Daniel R | -- | Lsi | |
| Nemanich Daniel R | -- | Stewart Title Of Ca Inc | |
| Nemanich Daniel R | -- | Stewart Title Of Ca Inc | |
| Nemanich Daniel R | -- | -- | |
| -- | $124,500 | -- | |
| -- | $116,500 | -- | |
| -- | $103,600 | -- |
Source: Public Records
Mortgage History
| Date | Status | Borrower | Loan Amount |
|---|---|---|---|
| Open | Nemanich Daniel R | $188,800 | |
| Closed | Nemanich Daniel R | $220,000 |
Source: Public Records
Tax History Compared to Growth
Tax History
| Year | Tax Paid | Tax Assessment Tax Assessment Total Assessment is a certain percentage of the fair market value that is determined by local assessors to be the total taxable value of land and additions on the property. | Land | Improvement |
|---|---|---|---|---|
| 2025 | $2,922 | $238,269 | $95,689 | $142,580 |
| 2024 | $2,922 | $233,598 | $93,813 | $139,785 |
| 2023 | $2,856 | $229,019 | $91,974 | $137,045 |
| 2022 | $2,780 | $224,529 | $90,171 | $134,358 |
| 2021 | $2,760 | $220,127 | $88,403 | $131,724 |
| 2020 | $2,727 | $217,871 | $87,497 | $130,374 |
| 2019 | $2,678 | $213,600 | $85,782 | $127,818 |
| 2018 | $2,506 | $209,412 | $84,100 | $125,312 |
| 2017 | $2,443 | $205,306 | $82,451 | $122,855 |
| 2016 | $2,403 | $201,282 | $80,835 | $120,447 |
| 2015 | $2,368 | $198,259 | $79,621 | $118,638 |
| 2014 | $2,332 | $194,377 | $78,062 | $116,315 |
Source: Public Records
Map
Nearby Homes
- 7857 Embry Point
- 7971 Jade Coast Rd
- 8177 Rose Quartz Cir
- 8246 Rose Quartz Cir
- 7506 Flanders Dr
- 10602 Melogold Way
- 8119 Rose Quartz Cir
- Plan 5 at Meadows District at 3Roots - Atwood
- Plan 2 at Meadows District at 3Roots - Atwood
- Plan 3 at Meadows District at 3Roots - Atwood
- Plan 4 at Meadows District at 3Roots - Atwood
- 14161 Carnelian Way
- 7427 Kamwood St
- 11050 Solstice Way
- 13920 Boyden Way
- 13932 Boyden Way
- 8014 Hemphill Dr
- 13897 Onyx Way
- 13889 Onyx Way
- 13905 Martel Way
- 7676 Northrup Dr
- 7662 Northrup Dr
- 7695 Northrup Place
- 7687 Northrup Place
- 10109 Parkdale Ave
- 10105 Parkdale Ave
- 7679 Northrup Place
- 10115 Parkdale Ave
- 7695 Northrup Dr
- 7648 Northrup Dr
- 7675 Northrup Dr
- 7655 Northrup Dr
- 10119 Parkdale Ave
- 7671 Northrup Place
- 10093 Parkdale Ave
- 7634 Northrup Dr
- 10125 Parkdale Ave
- 10084 Parkdale Ave
- 7635 Northrup Dr
- 10108 Knight Dr