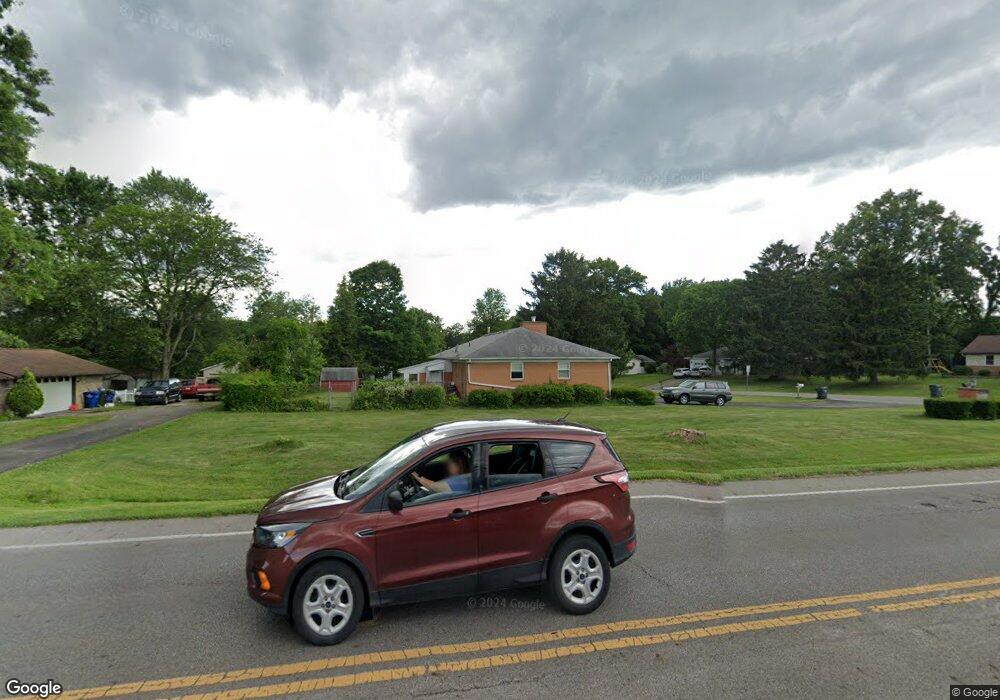
7691 Deer Park Way Reynoldsburg, OH 43068
Estimated Value: $284,091 - $346,000
3
Beds
3
Baths
1,310
Sq Ft
$243/Sq Ft
Est. Value
About This Home
This home is located at 7691 Deer Park Way, Reynoldsburg, OH 43068 and is currently estimated at $317,773, approximately $242 per square foot. 7691 Deer Park Way is a home located in Franklin County with nearby schools including North Elementary School, Licking Heights Central, and Licking Heights High School.
Ownership History
Date
Name
Owned For
Owner Type
Purchase Details
Closed on
Oct 6, 2011
Sold by
Bethea Melvin and Bethea Dorothy
Bought by
Bethea Melvin and Bethea Dorothy T
Current Estimated Value
Purchase Details
Closed on
Jun 10, 2009
Sold by
Bethea Melvin and Bethea Dorothy T
Bought by
Bethea Melvin and Bethea Doroty T
Home Financials for this Owner
Home Financials are based on the most recent Mortgage that was taken out on this home.
Original Mortgage
$179,029
Outstanding Balance
$114,025
Interest Rate
4.92%
Mortgage Type
FHA
Estimated Equity
$203,748
Purchase Details
Closed on
Oct 24, 2005
Sold by
Bethea Melvin and Bethea Dorothy T
Bought by
Bethea Melvin and Betheaaa Dorothy T
Purchase Details
Closed on
Jul 13, 2004
Sold by
Ayers Gerald E
Bought by
Bethea Melvin and Bethea Dorothy T
Home Financials for this Owner
Home Financials are based on the most recent Mortgage that was taken out on this home.
Original Mortgage
$124,000
Interest Rate
6.4%
Mortgage Type
Purchase Money Mortgage
Purchase Details
Closed on
Apr 27, 1988
Create a Home Valuation Report for This Property
The Home Valuation Report is an in-depth analysis detailing your home's value as well as a comparison with similar homes in the area
Home Values in the Area
Average Home Value in this Area
Purchase History
| Date | Buyer | Sale Price | Title Company |
|---|---|---|---|
| Bethea Melvin | -- | None Available | |
| Bethea Melvin | -- | Attorney | |
| Bethea Melvin | -- | -- | |
| Bethea Melvin | $155,000 | Gahanna Title | |
| -- | -- | -- |
Source: Public Records
Mortgage History
| Date | Status | Borrower | Loan Amount |
|---|---|---|---|
| Open | Bethea Melvin | $179,029 | |
| Closed | Bethea Melvin | $124,000 |
Source: Public Records
Tax History Compared to Growth
Tax History
| Year | Tax Paid | Tax Assessment Tax Assessment Total Assessment is a certain percentage of the fair market value that is determined by local assessors to be the total taxable value of land and additions on the property. | Land | Improvement |
|---|---|---|---|---|
| 2024 | $3,692 | $74,280 | $16,140 | $58,140 |
| 2023 | $3,816 | $74,270 | $16,135 | $58,135 |
| 2022 | $4,095 | $68,390 | $12,110 | $56,280 |
| 2021 | $3,986 | $68,390 | $12,110 | $56,280 |
| 2020 | $3,972 | $68,390 | $12,110 | $56,280 |
| 2019 | $3,366 | $55,060 | $9,700 | $45,360 |
| 2018 | $3,261 | $55,060 | $9,700 | $45,360 |
| 2017 | $3,334 | $55,060 | $9,700 | $45,360 |
| 2016 | $3,178 | $49,950 | $10,850 | $39,100 |
| 2015 | $3,137 | $49,950 | $10,850 | $39,100 |
| 2014 | $3,197 | $49,950 | $10,850 | $39,100 |
| 2013 | $1,664 | $52,570 | $11,410 | $41,160 |
Source: Public Records
Map
Nearby Homes
- 353 Waggoner Rd
- 307 Deer Trail Rd
- 108 Kingsmeadow Ln
- 8002 Overmont Ridge Rd
- 7645 Swindon St
- 267 Brueghel Rd
- 8142 Bellow Park Dr
- 7792 Rodebaugh Rd
- 7991 Windsome Ct
- 7920 Collins Dr
- 7914 Collins Dr
- 7898 Collins Dr
- 779 Clark Dr
- 7917 Collins Dr
- 7906 Collins Dr
- 7806 Collins Dr
- 7799 Collins Dr
- 738 Clark Dr
- 7895 Collins Dr
- Bexley Plan at Spring Hill Farm - Smart Essentials Collection
- 217 Waggoner Rd
- 7665 Deer Park Way
- 7692 Deer Park Way
- 225 Waggoner Rd
- 225 S Waggoner Rd
- 7680 Deer Park Way
- 222 Deer Trail Rd
- 7666 Deer Park Way
- 7654 Deer Park Way
- 137 Waggoner Rd
- 241 Waggoner Rd
- 230 Deer Trail Rd
- 7645 Deer Park Way
- 221 Deer Trail Rd
- 7636 Deer Park Way
- 244 Deer Trail Rd
- 255 Waggoner Rd
- 227 Deer Trail Rd
- 243 Deer Trail Rd
- 7620 Deer Park Way