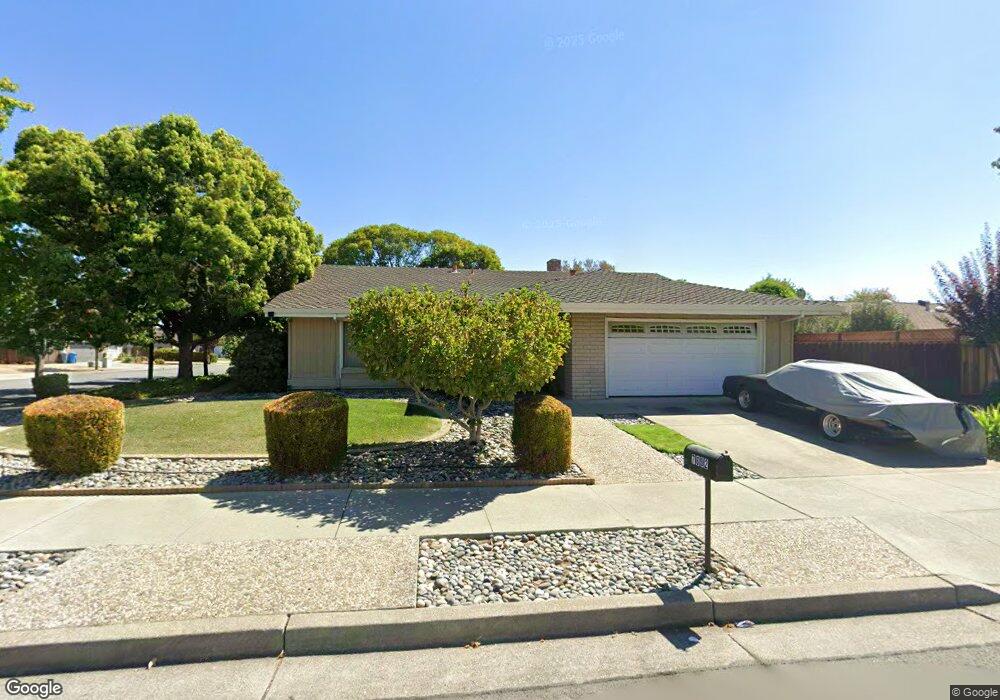
7692 Laurel Dr Gilroy, CA 95020
Estimated Value: $865,000 - $1,027,000
4
Beds
2
Baths
1,612
Sq Ft
$580/Sq Ft
Est. Value
About This Home
This home is located at 7692 Laurel Dr, Gilroy, CA 95020 and is currently estimated at $934,648, approximately $579 per square foot. 7692 Laurel Dr is a home located in Santa Clara County with nearby schools including El Roble Elementary School, Brownell Middle School, and Solorsano Middle School.
Ownership History
Date
Name
Owned For
Owner Type
Purchase Details
Closed on
May 1, 2009
Sold by
Fdic
Bought by
Faris Mario E
Current Estimated Value
Purchase Details
Closed on
Feb 20, 2009
Sold by
Salinas Vicente
Bought by
Indymac Federal Bank Fsb
Purchase Details
Closed on
Mar 22, 2007
Sold by
Arvizu Eva
Bought by
Salinas Vicente
Home Financials for this Owner
Home Financials are based on the most recent Mortgage that was taken out on this home.
Original Mortgage
$532,000
Interest Rate
6.75%
Mortgage Type
Purchase Money Mortgage
Purchase Details
Closed on
Jul 26, 2006
Sold by
Cecil Robert D
Bought by
Christopher Palms Llc
Create a Home Valuation Report for This Property
The Home Valuation Report is an in-depth analysis detailing your home's value as well as a comparison with similar homes in the area
Home Values in the Area
Average Home Value in this Area
Purchase History
| Date | Buyer | Sale Price | Title Company |
|---|---|---|---|
| Faris Mario E | $325,000 | Chicago Title Company | |
| Indymac Federal Bank Fsb | $321,018 | None Available | |
| Salinas Vicente | -- | Chicago Title Company | |
| Salinas Vicente | $665,000 | Chicago Title Company | |
| Christopher Palms Llc | $601,000 | Chicago Title Company |
Source: Public Records
Mortgage History
| Date | Status | Borrower | Loan Amount |
|---|---|---|---|
| Previous Owner | Salinas Vicente | $532,000 | |
| Previous Owner | Salinas Vicente | $133,000 |
Source: Public Records
Tax History
| Year | Tax Paid | Tax Assessment Tax Assessment Total Assessment is a certain percentage of the fair market value that is determined by local assessors to be the total taxable value of land and additions on the property. | Land | Improvement |
|---|---|---|---|---|
| 2025 | $5,159 | $418,506 | $167,401 | $251,105 |
| 2024 | $5,159 | $410,301 | $164,119 | $246,182 |
| 2023 | $5,128 | $402,256 | $160,901 | $241,355 |
| 2022 | $5,043 | $394,370 | $157,747 | $236,623 |
| 2021 | $5,020 | $386,638 | $154,654 | $231,984 |
| 2020 | $4,965 | $382,675 | $153,069 | $229,606 |
| 2019 | $4,920 | $375,172 | $150,068 | $225,104 |
| 2018 | $4,596 | $367,817 | $147,126 | $220,691 |
| 2017 | $4,691 | $360,606 | $144,242 | $216,364 |
| 2016 | $4,593 | $353,536 | $141,414 | $212,122 |
| 2015 | $4,335 | $348,226 | $139,290 | $208,936 |
| 2014 | $4,308 | $341,406 | $136,562 | $204,844 |
Source: Public Records
Map
Nearby Homes
- 7611 Westwood Dr
- 1330 Redwood Ln
- 7902 English Oak Cir
- 7942 English Oak Cir
- 1720 Wasabi Way
- 7440 Carnoustie Ct
- 7680 Santa Paula Dr
- 1555 Hecker Pass Rd Unit H102
- 0 California 152
- 8120 Catalina Ct
- 1826 Club Dr
- 1610 Calabrese Way
- 1008 Primrose Ln
- 7277 Pitlochry Dr
- 8255 Rancho Real
- 925 Blake Ct
- 7821 Santa Theresa Dr
- 7969 Kipling Cir
- 730 Tennyson Dr
- 1750 Vista Del Sur
Your Personal Tour Guide
Ask me questions while you tour the home.