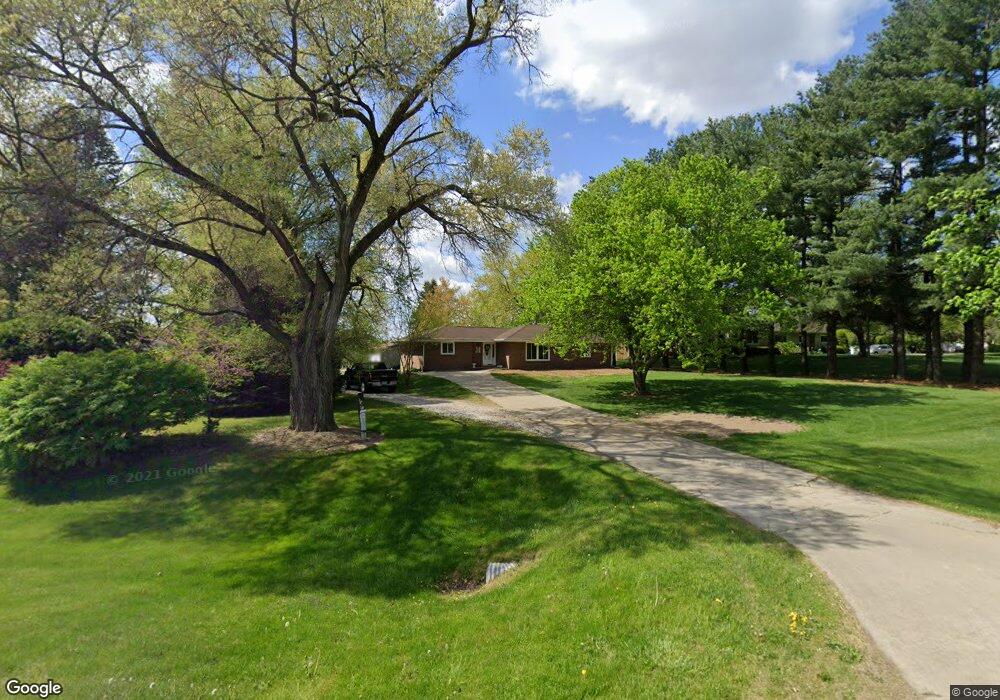
7697 SE Vandalia Dr Runnells, IA 50237
Estimated Value: $303,000 - $406,000
2
Beds
2
Baths
1,560
Sq Ft
$228/Sq Ft
Est. Value
About This Home
This home is located at 7697 SE Vandalia Dr, Runnells, IA 50237 and is currently estimated at $356,192, approximately $228 per square foot. 7697 SE Vandalia Dr is a home located in Polk County with nearby schools including Runnells Elementary School, Southeast Polk Spring Creek- 6th Grade, and Southeast Polk Junior High School.
Ownership History
Date
Name
Owned For
Owner Type
Purchase Details
Closed on
Dec 30, 2020
Sold by
Dooley Ronnie Jake and Dooley Cynthia S
Bought by
Mendez Brenton A and Mendez Kristin N
Current Estimated Value
Home Financials for this Owner
Home Financials are based on the most recent Mortgage that was taken out on this home.
Original Mortgage
$192,000
Outstanding Balance
$170,968
Interest Rate
2.71%
Mortgage Type
New Conventional
Estimated Equity
$185,224
Purchase Details
Closed on
Jul 17, 2008
Sold by
Dooley Ronnie Jake and Dooley Cynthia S
Bought by
Dooley Ronnie Jake and Dooley Cynthia S
Purchase Details
Closed on
Dec 14, 2007
Sold by
Mceuen Ramona Ellan and Dooley Ronnie Jake
Bought by
Mceuen Ramona Ellan and Dooley Ronnie Jake
Create a Home Valuation Report for This Property
The Home Valuation Report is an in-depth analysis detailing your home's value as well as a comparison with similar homes in the area
Home Values in the Area
Average Home Value in this Area
Purchase History
| Date | Buyer | Sale Price | Title Company |
|---|---|---|---|
| Mendez Brenton A | $240,000 | None Available | |
| Dooley Ronnie Jake | -- | None Available | |
| Dooley Ronnie Jake | $100,000 | None Available | |
| Mceuen Ramona Ellan | -- | None Available |
Source: Public Records
Mortgage History
| Date | Status | Borrower | Loan Amount |
|---|---|---|---|
| Open | Mendez Brenton A | $192,000 |
Source: Public Records
Tax History Compared to Growth
Tax History
| Year | Tax Paid | Tax Assessment Tax Assessment Total Assessment is a certain percentage of the fair market value that is determined by local assessors to be the total taxable value of land and additions on the property. | Land | Improvement |
|---|---|---|---|---|
| 2025 | $4,278 | $353,300 | $109,600 | $243,700 |
| 2024 | $4,278 | $303,400 | $98,700 | $204,700 |
| 2023 | $3,868 | $303,400 | $98,700 | $204,700 |
| 2022 | $3,820 | $231,800 | $78,700 | $153,100 |
| 2021 | $3,704 | $231,800 | $78,700 | $153,100 |
| 2020 | $3,652 | $205,100 | $69,500 | $135,600 |
| 2019 | $3,348 | $205,100 | $69,500 | $135,600 |
| 2018 | $3,368 | $180,500 | $60,000 | $120,500 |
| 2017 | $3,462 | $180,500 | $60,000 | $120,500 |
| 2016 | $3,464 | $166,400 | $54,800 | $111,600 |
| 2015 | $3,464 | $166,400 | $54,800 | $111,600 |
| 2014 | $3,746 | $176,300 | $57,900 | $118,400 |
Source: Public Records
Map
Nearby Homes
- 7820 SE Vandalia Dr
- 7930 SE Vandalia Dr
- 3350 SE 82nd St
- 7295 SE Vandalia Dr
- 3356 SE 82nd St
- 2511 SE 82nd St
- 2496 SE 83rd Ct
- 6317 SE Vandalia Dr
- 6373 SE Vandalia Dr
- 3320 SE 96th St
- 3380 SE 96th St
- 7046 SE 7th Ave
- 6922 SE 7th Ave
- 6918 SE 7th Ave
- 6806 SE 7th Ave
- 6802 SE 7th Ave
- 5792 Arbor Hills Ct
- 5736 Arbor Hills Ct
- 5766 Arbor Springs Dr
- 70 Pennsylvania St
- 7695 SE Vandalia Dr
- 7707 SE Vandalia Dr
- 7633 SE Vandalia Dr
- 7720 SE Vandalia Dr
- 7778 SE Vandalia Dr
- 7625 SE Vandalia Dr
- 4393 SE 76th St
- 4343 SE 76th St
- 4277 SE 76th St
- 7815 SE Vandalia Dr
- 4499 SE 76th St
- 7696 SE Vandalia Dr
- 7660 SE Vandalia Dr
- 7611 SE Vandalia Dr
- 4598 SE 76th St
- 7820 SE Vandalia Dr
- 4290 SE 76th St
- 7606 SE Vandalia Dr
- 7898 SE Vandalia Dr
- 7925 SE Vandalia Dr