Estimated Value: $343,000 - $370,000
3
Beds
2
Baths
1,960
Sq Ft
$181/Sq Ft
Est. Value
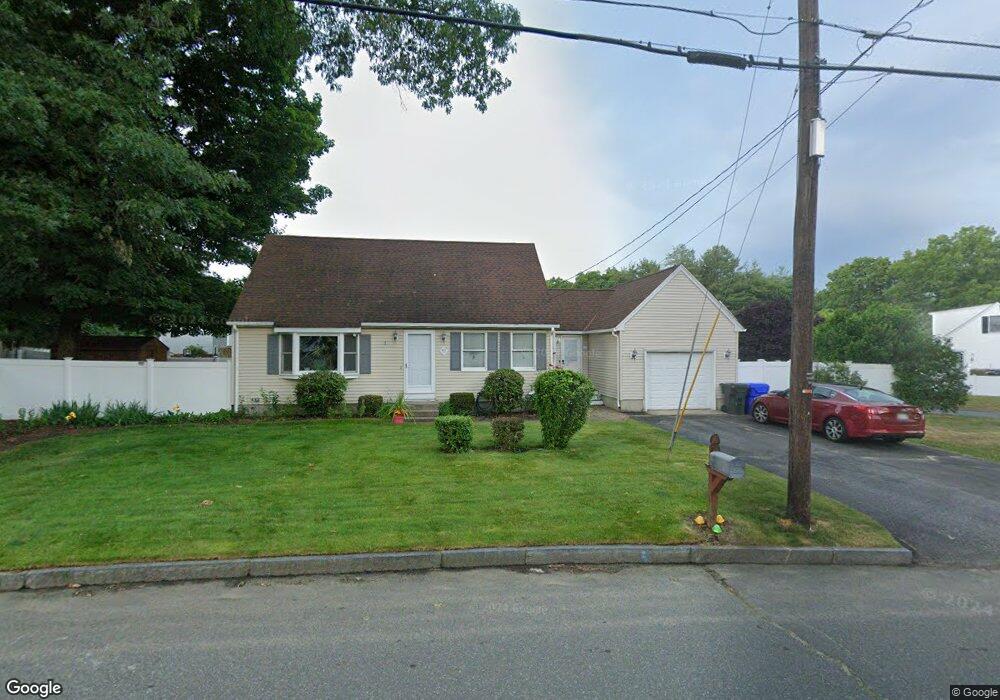
About This Home
This home is located at 77 2nd St, Springfield, MA 01104 and is currently estimated at $355,559, approximately $181 per square foot. 77 2nd St is a home located in Hampden County with nearby schools including Daniel B Brunton, John F. Kennedy Academy, and Springfield Central High School.
Ownership History
Date
Name
Owned For
Owner Type
Purchase Details
Closed on
Apr 19, 1989
Sold by
Shapiro Leo J
Bought by
Costa Carlos M
Current Estimated Value
Home Financials for this Owner
Home Financials are based on the most recent Mortgage that was taken out on this home.
Original Mortgage
$75,000
Interest Rate
10.79%
Mortgage Type
Purchase Money Mortgage
Create a Home Valuation Report for This Property
The Home Valuation Report is an in-depth analysis detailing your home's value as well as a comparison with similar homes in the area
Home Values in the Area
Average Home Value in this Area
Purchase History
| Date | Buyer | Sale Price | Title Company |
|---|---|---|---|
| Costa Carlos M | $119,500 | -- |
Source: Public Records
Mortgage History
| Date | Status | Borrower | Loan Amount |
|---|---|---|---|
| Open | Costa Carlos M | $35,000 | |
| Closed | Costa Carlos M | $56,300 | |
| Closed | Costa Carlos M | $81,000 | |
| Closed | Costa Carlos M | $75,000 |
Source: Public Records
Tax History
| Year | Tax Paid | Tax Assessment Tax Assessment Total Assessment is a certain percentage of the fair market value that is determined by local assessors to be the total taxable value of land and additions on the property. | Land | Improvement |
|---|---|---|---|---|
| 2025 | $5,645 | $360,000 | $39,300 | $320,700 |
| 2024 | $5,464 | $340,200 | $39,300 | $300,900 |
| 2023 | $5,135 | $301,200 | $36,600 | $264,600 |
| 2022 | $4,408 | $234,200 | $34,200 | $200,000 |
| 2021 | $4,251 | $224,900 | $31,100 | $193,800 |
| 2020 | $4,234 | $216,800 | $31,100 | $185,700 |
| 2019 | $4,064 | $206,500 | $32,100 | $174,400 |
| 2018 | $3,893 | $197,800 | $32,100 | $165,700 |
| 2017 | $3,537 | $179,900 | $29,100 | $150,800 |
| 2016 | $3,350 | $170,400 | $29,100 | $141,300 |
| 2015 | $3,373 | $171,500 | $29,100 | $142,400 |
Source: Public Records
Map
Nearby Homes
- 294 Tremont St
- 83 Oakdale St
- 93 Grochmal Ave Unit 12
- 4 Seneca St
- 19 Emily St
- 28 Mockingbird Dr
- 147 Bowles Park
- 108 Barre St
- 66 Bromont St
- 1289 Bay St
- 543 Boston Rd
- 251 Edendale St
- 181 Marsden St
- 225 Osborne Terrace
- 58 Eureka St
- 1045-1047 Worcester St
- 270 Berkshire Ave
- 78 Massreco St
- 63 Peer St
- 106 Almira Rd
Your Personal Tour Guide
Ask me questions while you tour the home.