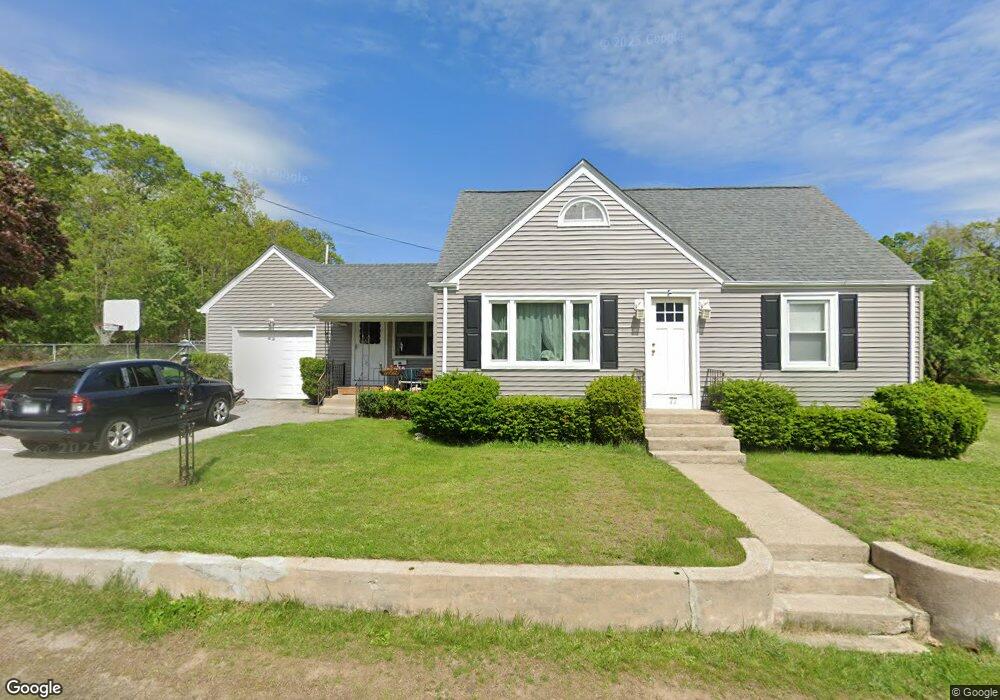
77 Aberdeen St West Warwick, RI 02893
Lippitt-Harris NeighborhoodEstimated Value: $383,000 - $397,000
3
Beds
1
Bath
1,165
Sq Ft
$334/Sq Ft
Est. Value
About This Home
This home is located at 77 Aberdeen St, West Warwick, RI 02893 and is currently estimated at $389,083, approximately $333 per square foot. 77 Aberdeen St is a home located in Kent County with nearby schools including West Warwick High School, St Joseph School, and Islamic School of Rhode Island.
Ownership History
Date
Name
Owned For
Owner Type
Purchase Details
Closed on
Dec 21, 2007
Sold by
Wells Fargo Bank Na
Bought by
Deboer Catherine and Pronteau Paul E
Current Estimated Value
Home Financials for this Owner
Home Financials are based on the most recent Mortgage that was taken out on this home.
Original Mortgage
$162,800
Outstanding Balance
$103,046
Interest Rate
6.3%
Mortgage Type
Purchase Money Mortgage
Estimated Equity
$286,037
Purchase Details
Closed on
Jul 11, 1997
Sold by
Zaino Judy A and Aubin Theresa F
Bought by
Capobianco Brian R and Capobianco Joanne
Home Financials for this Owner
Home Financials are based on the most recent Mortgage that was taken out on this home.
Original Mortgage
$106,749
Interest Rate
7.86%
Purchase Details
Closed on
Sep 19, 1994
Sold by
Ray Manuel and Ray Theresa
Bought by
Iannuccilli Judy A and Aubin Theresa F
Home Financials for this Owner
Home Financials are based on the most recent Mortgage that was taken out on this home.
Original Mortgage
$97,100
Interest Rate
8.38%
Create a Home Valuation Report for This Property
The Home Valuation Report is an in-depth analysis detailing your home's value as well as a comparison with similar homes in the area
Home Values in the Area
Average Home Value in this Area
Purchase History
| Date | Buyer | Sale Price | Title Company |
|---|---|---|---|
| Deboer Catherine | $203,500 | -- | |
| Capobianco Brian R | $107,000 | -- | |
| Iannuccilli Judy A | $100,000 | -- |
Source: Public Records
Mortgage History
| Date | Status | Borrower | Loan Amount |
|---|---|---|---|
| Open | Iannuccilli Judy A | $162,800 | |
| Previous Owner | Iannuccilli Judy A | $152,000 | |
| Previous Owner | Iannuccilli Judy A | $106,749 | |
| Previous Owner | Iannuccilli Judy A | $97,100 |
Source: Public Records
Tax History Compared to Growth
Tax History
| Year | Tax Paid | Tax Assessment Tax Assessment Total Assessment is a certain percentage of the fair market value that is determined by local assessors to be the total taxable value of land and additions on the property. | Land | Improvement |
|---|---|---|---|---|
| 2025 | $4,993 | $349,400 | $93,400 | $256,000 |
| 2024 | $4,945 | $264,600 | $76,400 | $188,200 |
| 2023 | $4,847 | $264,600 | $76,400 | $188,200 |
| 2022 | $4,773 | $264,600 | $76,400 | $188,200 |
| 2021 | $5,026 | $218,500 | $64,200 | $154,300 |
| 2020 | $5,026 | $218,500 | $64,200 | $154,300 |
| 2019 | $6,406 | $218,500 | $64,200 | $154,300 |
| 2018 | $4,409 | $162,200 | $61,400 | $100,800 |
| 2017 | $4,267 | $162,200 | $61,400 | $100,800 |
| 2016 | $4,191 | $162,200 | $61,400 | $100,800 |
| 2015 | $4,089 | $157,500 | $61,400 | $96,100 |
| 2014 | $1,000 | $157,500 | $61,400 | $96,100 |
Source: Public Records
Map
Nearby Homes