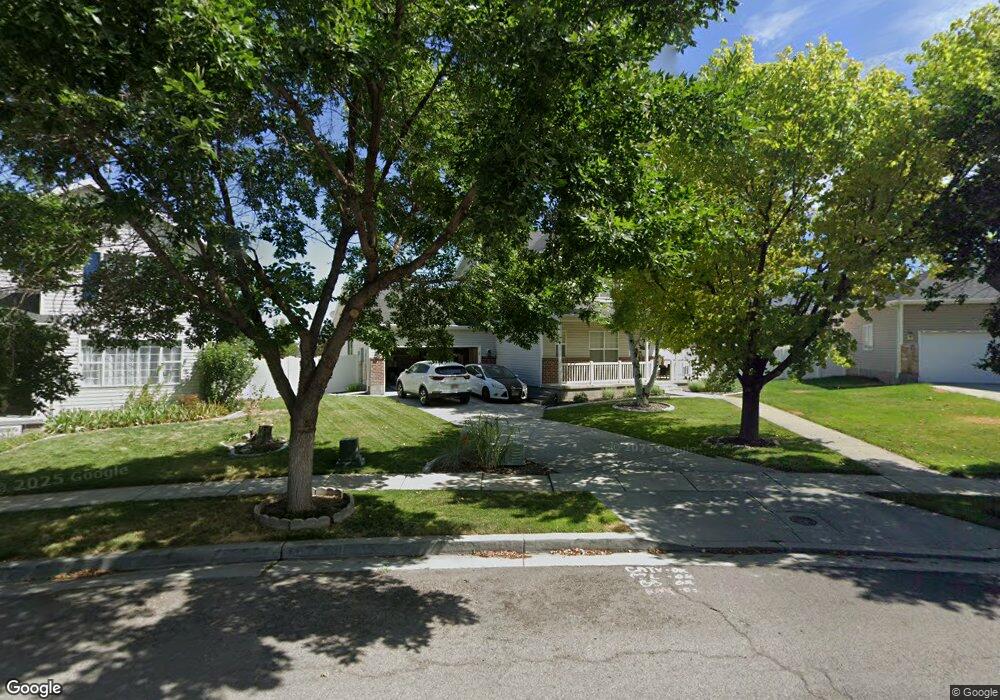
77 Aparicio Dr Tooele, UT 84074
Estimated Value: $440,788 - $488,000
3
Beds
3
Baths
2,268
Sq Ft
$205/Sq Ft
Est. Value
About This Home
This home is located at 77 Aparicio Dr, Tooele, UT 84074 and is currently estimated at $464,447, approximately $204 per square foot. 77 Aparicio Dr is a home located in Tooele County with nearby schools including Overlake Elementary School, Clarke N. Johnsen Junior High School, and Stansbury High School.
Ownership History
Date
Name
Owned For
Owner Type
Purchase Details
Closed on
Dec 6, 2025
Sold by
Fortson Trent Emery
Bought by
Fortson Trent Emery and Fortson Abigail Autumn
Current Estimated Value
Home Financials for this Owner
Home Financials are based on the most recent Mortgage that was taken out on this home.
Original Mortgage
$84,000
Outstanding Balance
$84,000
Interest Rate
5.41%
Mortgage Type
New Conventional
Estimated Equity
$380,447
Purchase Details
Closed on
Mar 18, 2021
Sold by
Olson Richard L and Olson Lara L
Bought by
Fortson Trent Emery
Home Financials for this Owner
Home Financials are based on the most recent Mortgage that was taken out on this home.
Original Mortgage
$340,470
Interest Rate
2.7%
Mortgage Type
New Conventional
Purchase Details
Closed on
Apr 21, 2005
Sold by
Angelieri Michael J and Angelieri Gabriel
Bought by
Olson Richard L and Olson Lara L
Home Financials for this Owner
Home Financials are based on the most recent Mortgage that was taken out on this home.
Original Mortgage
$6,000
Interest Rate
5.84%
Mortgage Type
Stand Alone Second
Create a Home Valuation Report for This Property
The Home Valuation Report is an in-depth analysis detailing your home's value as well as a comparison with similar homes in the area
Purchase History
| Date | Buyer | Sale Price | Title Company |
|---|---|---|---|
| Fortson Trent Emery | -- | Stewart Title | |
| Fortson Trent Emery | -- | Eagle Gate Title Ins Agcy | |
| Olson Richard L | -- | First American Title Ins Inc |
Source: Public Records
Mortgage History
| Date | Status | Borrower | Loan Amount |
|---|---|---|---|
| Open | Fortson Trent Emery | $84,000 | |
| Previous Owner | Fortson Trent Emery | $340,470 | |
| Previous Owner | Olson Richard L | $6,000 |
Source: Public Records
Tax History
| Year | Tax Paid | Tax Assessment Tax Assessment Total Assessment is a certain percentage of the fair market value that is determined by local assessors to be the total taxable value of land and additions on the property. | Land | Improvement |
|---|---|---|---|---|
| 2025 | $2,628 | $385,085 | $107,500 | $277,585 |
| 2024 | $2,653 | $196,181 | $59,125 | $137,056 |
| 2023 | $2,653 | $231,568 | $56,302 | $175,266 |
| 2022 | $2,968 | $245,252 | $69,245 | $176,007 |
| 2021 | $2,257 | $155,035 | $22,619 | $132,416 |
| 2020 | $2,117 | $256,086 | $41,125 | $214,961 |
| 2019 | $2,053 | $245,850 | $41,125 | $204,725 |
| 2018 | $1,786 | $203,496 | $30,000 | $173,496 |
| 2017 | $1,425 | $192,146 | $30,000 | $162,146 |
| 2016 | $1,273 | $94,960 | $11,000 | $83,960 |
| 2015 | $1,273 | $90,308 | $0 | $0 |
| 2014 | -- | $90,308 | $0 | $0 |
Source: Public Records
Map
Nearby Homes
- 88 Aparicio Dr
- 182 Aparicio Dr
- 1742 N 80 E
- 2042 N Essie Dr
- 1651 N 40 E
- 1909 N 70 W
- 1893 N 70 W
- 81 W 1930 N
- 94 E Broxburn Way
- 179 Green Pines Ave
- 2129 N Berra Blvd
- 58 W 1570 N
- 1725 180 E Unit D137
- 2124 N 90 W
- 1245 N Clemente Way
- 1648 Dawson Ln
- 1618 N 210 E
- 1456 N Berra Blvd Unit 228
- 1428 Baen Way Unit 241
- 1598 N 210 E Unit 107
- 77 Aparicio Dr Unit 707
- 67 Aparicio Dr
- 87 Aparicio Dr
- 97 E 1910 N
- 57 Aparicio Dr
- 56 Aparicio Dr
- 107 E 1910 N
- 47 Aparicio Dr
- 645 E Oliver Rd Unit 137
- 654 E 740 N Unit 132
- 46 Aparicio Dr
- 106 E 1910 N
- 117 E 1910 N
- 35 Aparicio Dr
- 65 E 1860 N
- 36 Aparicio Dr
- 55 E 1860 N
- 75 E 1860 N
- 116 E 1910 N
- 87 E 1860 N
Your Personal Tour Guide
Ask me questions while you tour the home.