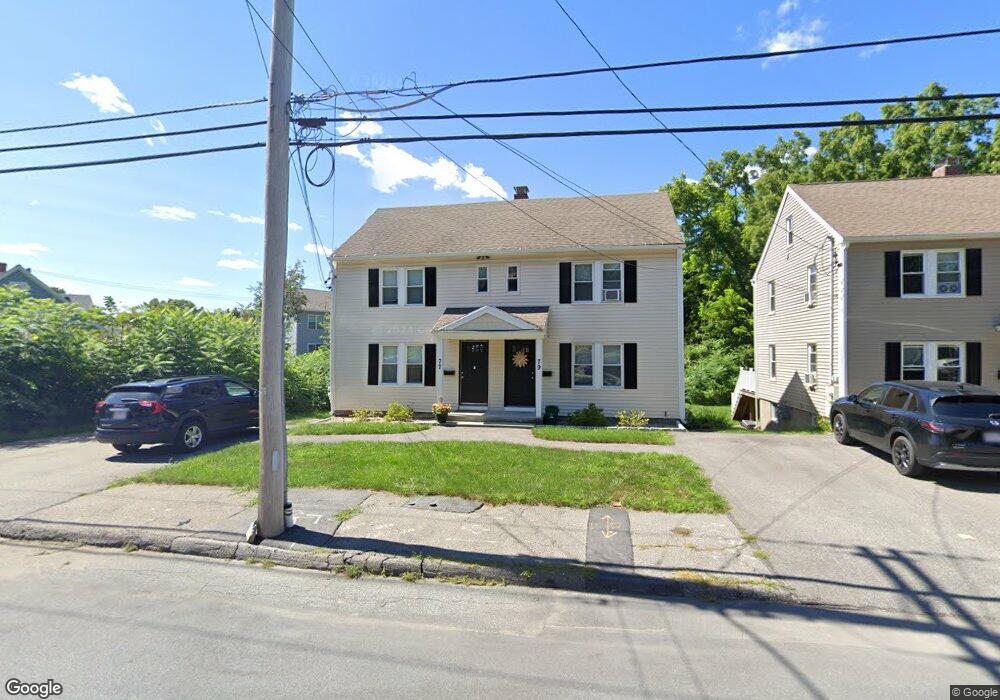
77 Brooks St Worcester, MA 01606
Greendale NeighborhoodEstimated Value: $439,000 - $585,000
About This Home
Property Id: 1601225
Townhome living at 105 Brooks Street, on Worcester's north side in the West Boylston/Holden side of Worcester. Vinyl siding, energy-efficient windows, granite, full basement for storage, beautiful expansive yard, freshly painted and professionally designed with classic cottage styling. Off-street parking in a neighborhood setting combined with immediate highway access and convenient shopping make this an ideal rental property. Close to area Colleges and Universities and UMass Medical. Located just a short walk from Kendrick Field in Worcester with outdoor play gym, basketball courts and ball fields, there is so much to offer in this great neighborhood at Brooks Landing! First, Last, Security required. 640+ credit and a gross monthly income of $6930+
Ownership History
Purchase Details
Home Financials for this Owner
Home Financials are based on the most recent Mortgage that was taken out on this home.Home Values in the Area
Average Home Value in this Area
Purchase History
| Date | Buyer | Sale Price | Title Company |
|---|---|---|---|
| 969 Main Realty Llc | $1,570,871 | -- |
Mortgage History
| Date | Status | Borrower | Loan Amount |
|---|---|---|---|
| Open | 969 Main Realty Llc | $1,739,987 |
Property History
| Date | Event | Price | List to Sale | Price per Sq Ft |
|---|---|---|---|---|
| 10/09/2024 10/09/24 | Price Changed | $2,100 | -4.5% | -- |
| 10/01/2024 10/01/24 | For Rent | $2,200 | -- | -- |
Tax History
| Year | Tax Paid | Tax Assessment Tax Assessment Total Assessment is a certain percentage of the fair market value that is determined by local assessors to be the total taxable value of land and additions on the property. | Land | Improvement |
|---|---|---|---|---|
| 2025 | $5,173 | $392,200 | $117,500 | $274,700 |
| 2024 | $5,044 | $366,800 | $117,500 | $249,300 |
| 2023 | $4,582 | $319,500 | $102,200 | $217,300 |
| 2022 | $4,549 | $299,100 | $81,800 | $217,300 |
| 2021 | $3,886 | $238,700 | $65,400 | $173,300 |
| 2020 | $3,524 | $207,300 | $65,400 | $141,900 |
| 2019 | $3,497 | $194,300 | $58,800 | $135,500 |
| 2018 | $3,604 | $190,600 | $58,800 | $131,800 |
| 2017 | $3,623 | $188,500 | $58,800 | $129,700 |
| 2016 | $3,442 | $167,000 | $42,700 | $124,300 |
| 2015 | $3,352 | $167,000 | $42,700 | $124,300 |
| 2014 | $3,263 | $167,000 | $42,700 | $124,300 |
Map
- 30 Danielles Way
- 41 Mohave Rd
- 37 Mohave Rd
- 39 Whitmarsh Ave
- 331 Burncoat St
- 323 Burncoat St
- 66 Eunice Ave
- 53 Collins St
- 55 Clark St
- 15 Ericsson St
- 120 Brattle St
- 270 Brattle St
- 39 Mountainshire Dr
- 82 Holden St
- 218 Holden St
- 42 N Worcester Ave
- 58 Osceola Ave
- 13 Fatima Ln
- 44 Boardman St
- 31 Danielles Way
Ask me questions while you tour the home.