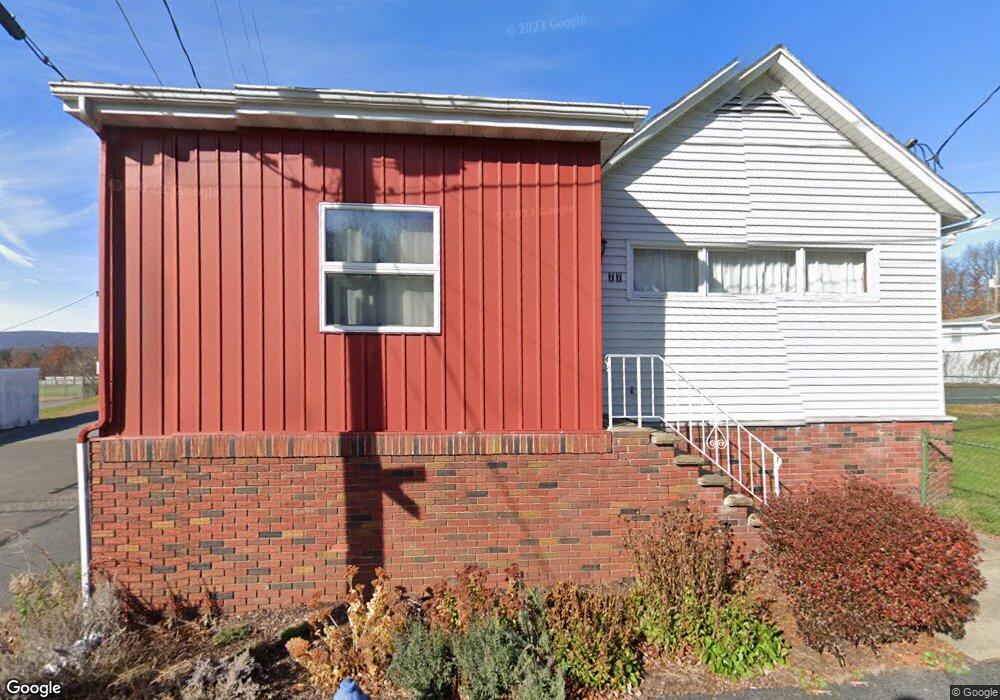
77 Bryden St Pittston, PA 18640
Estimated Value: $137,000 - $158,000
--
Bed
--
Bath
964
Sq Ft
$150/Sq Ft
Est. Value
About This Home
This home is located at 77 Bryden St, Pittston, PA 18640 and is currently estimated at $144,448, approximately $149 per square foot. 77 Bryden St is a home located in Luzerne County with nearby schools including Pittston City Intermediate Center, Pittston Area Middle School, and Pittston Area Senior High School.
Ownership History
Date
Name
Owned For
Owner Type
Purchase Details
Closed on
May 24, 2021
Sold by
Musto Raphael and Estate Of James Musto
Bought by
Musto Raphael
Current Estimated Value
Purchase Details
Closed on
Mar 29, 2021
Sold by
Musto Raphael and Estate Of James Musto
Bought by
Musto Raphael and Musto Karen
Purchase Details
Closed on
Mar 28, 2021
Sold by
Musto Raphael and Musto Karen
Bought by
Montagna Jo Ann and Higgins Irrevocable Grantor Tr
Purchase Details
Closed on
Jan 1, 1960
Bought by
Musto James and Musto Gertrude
Create a Home Valuation Report for This Property
The Home Valuation Report is an in-depth analysis detailing your home's value as well as a comparison with similar homes in the area
Home Values in the Area
Average Home Value in this Area
Purchase History
| Date | Buyer | Sale Price | Title Company |
|---|---|---|---|
| Musto Raphael | -- | None Available | |
| Musto Raphael | $1,320 | None Available | |
| Montagna Jo Ann | $500 | None Available | |
| Musto James | -- | -- |
Source: Public Records
Tax History Compared to Growth
Tax History
| Year | Tax Paid | Tax Assessment Tax Assessment Total Assessment is a certain percentage of the fair market value that is determined by local assessors to be the total taxable value of land and additions on the property. | Land | Improvement |
|---|---|---|---|---|
| 2025 | $1,723 | $69,500 | $30,200 | $39,300 |
| 2024 | $1,695 | $69,500 | $30,200 | $39,300 |
| 2023 | $1,695 | $69,500 | $30,200 | $39,300 |
| 2022 | $1,648 | $69,500 | $30,200 | $39,300 |
| 2021 | $1,574 | $67,100 | $27,800 | $39,300 |
| 2020 | $1,537 | $67,100 | $27,800 | $39,300 |
| 2019 | $1,524 | $67,100 | $27,800 | $39,300 |
| 2018 | $1,474 | $67,100 | $27,800 | $39,300 |
| 2017 | $1,439 | $67,100 | $27,800 | $39,300 |
| 2016 | -- | $67,100 | $27,800 | $39,300 |
| 2015 | -- | $67,100 | $27,800 | $39,300 |
| 2014 | -- | $67,100 | $27,800 | $39,300 |
Source: Public Records
Map
Nearby Homes