77 Chapman St Dracut, MA 01826
Estimated Value: $552,449 - $645,000
2
Beds
1
Bath
1,510
Sq Ft
$386/Sq Ft
Est. Value
About This Home
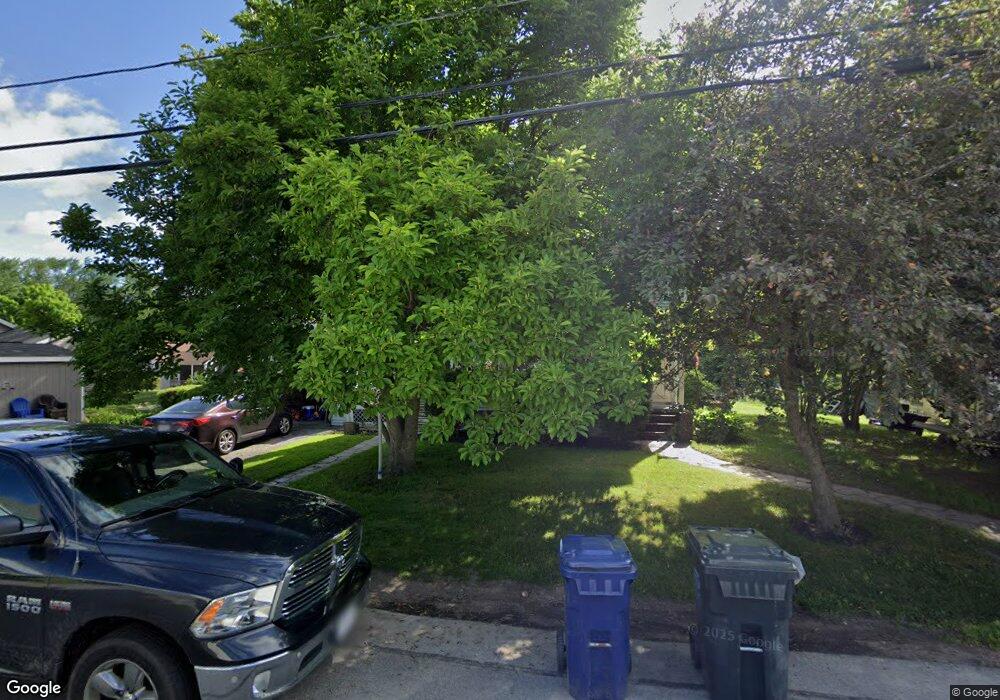
This home is located at 77 Chapman St, Dracut, MA 01826 and is currently estimated at $582,112, approximately $385 per square foot. 77 Chapman St is a home located in Middlesex County with nearby schools including Greenmont Avenue School, Richardson Middle School, and Dracut Senior High School.
Ownership History
Date
Name
Owned For
Owner Type
Purchase Details
Closed on
Apr 17, 1997
Sold by
Webster Bank
Bought by
Honan John J and Honan John F
Current Estimated Value
Purchase Details
Closed on
Apr 14, 1997
Sold by
Conroy Kevin E
Bought by
Webster Bank
Purchase Details
Closed on
Apr 22, 1988
Sold by
Mccaffrey Leo J
Bought by
Conroy Kevin E
Create a Home Valuation Report for This Property
The Home Valuation Report is an in-depth analysis detailing your home's value as well as a comparison with similar homes in the area
Home Values in the Area
Average Home Value in this Area
Purchase History
We collect this data history from publicly available records. To have your information removed, we recommend requesting removal directly through your county’s website.
| Date | Buyer | Sale Price | Title Company |
|---|---|---|---|
| Honan John J | $114,000 | -- | |
| Webster Bank | $90,950 | -- | |
| Conroy Kevin E | $134,900 | -- |
Source: Public Records
Mortgage History
We collect this data history from publicly available records. To have your information removed, we recommend requesting removal directly through your county’s website.
| Date | Status | Borrower | Loan Amount |
|---|---|---|---|
| Open | Conroy Kevin E | $232,000 | |
| Closed | Conroy Kevin E | $213,750 | |
| Closed | Conroy Kevin E | $15,000 |
Source: Public Records
Tax History
| Year | Tax Paid | Tax Assessment Tax Assessment Total Assessment is a certain percentage of the fair market value that is determined by local assessors to be the total taxable value of land and additions on the property. | Land | Improvement |
|---|---|---|---|---|
| 2025 | $4,904 | $484,600 | $201,300 | $283,300 |
| 2024 | $4,876 | $466,600 | $191,700 | $274,900 |
| 2023 | $4,661 | $402,500 | $166,700 | $235,800 |
| 2022 | $4,728 | $384,700 | $151,500 | $233,200 |
| 2021 | $4,557 | $350,300 | $137,700 | $212,600 |
| 2020 | $4,567 | $342,100 | $133,600 | $208,500 |
| 2019 | $4,184 | $304,300 | $127,200 | $177,100 |
| 2018 | $4,109 | $290,600 | $127,200 | $163,400 |
| 2017 | $3,874 | $290,600 | $127,200 | $163,400 |
| 2016 | $3,750 | $252,700 | $122,300 | $130,400 |
| 2015 | $3,588 | $240,300 | $122,300 | $118,000 |
| 2014 | $3,363 | $232,100 | $122,300 | $109,800 |
Source: Public Records
Map
Nearby Homes
- 1544 Bridge St
- 112 Genest St Unit 9
- 50 Frank St Unit 50
- 551 Hildreth St Unit 21
- 10 Lanseigne St
- 51 Willard St
- 417 Hildreth St Unit 12
- 246 Aiken Ave Unit 7
- 160 Orleans St
- 185 18th St
- 23 18th St
- 341 Broadway Rd
- 18 Sutherland St
- 4 Hazelwood Ave Unit 12
- 13 Esther Way Unit 7
- 15 Esther Way Unit Lot 8
- 24 Waldo St
- 192 Hildreth St
- 69 Lilley Ave
- 1064 Lakeview Ave
Your Personal Tour Guide
Ask me questions while you tour the home.