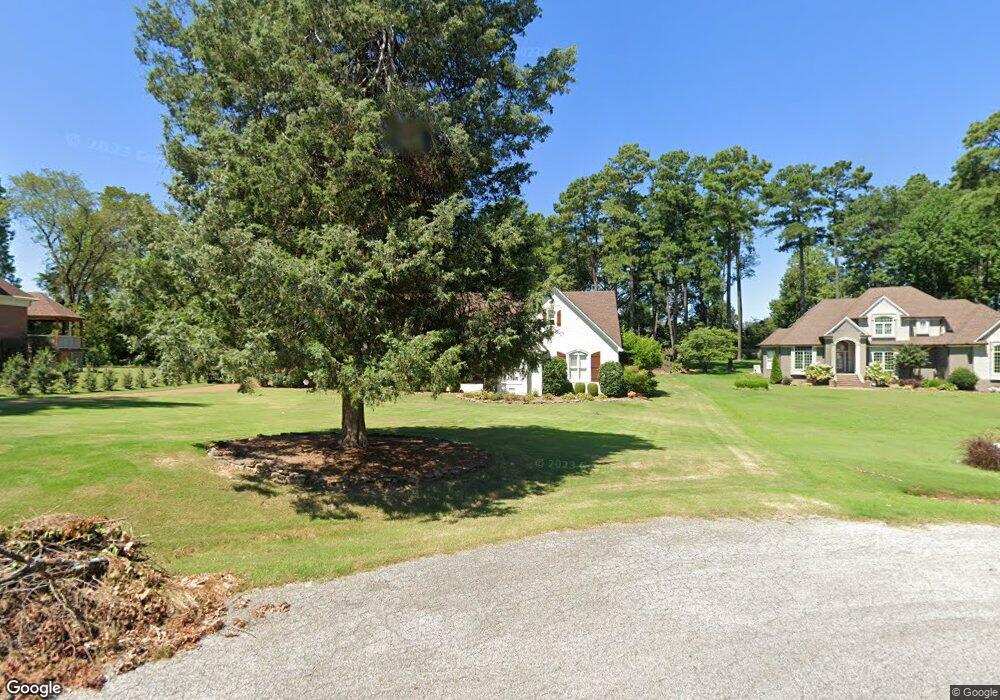
77 Elmhurst Dr Jackson, TN 38305
Estimated Value: $466,503 - $522,000
4
Beds
3
Baths
3,654
Sq Ft
$138/Sq Ft
Est. Value
About This Home
This home is located at 77 Elmhurst Dr, Jackson, TN 38305 and is currently estimated at $502,876, approximately $137 per square foot. 77 Elmhurst Dr is a home located in Madison County with nearby schools including Pope School, Northeast Middle School, and North Side High School.
Ownership History
Date
Name
Owned For
Owner Type
Purchase Details
Closed on
Jul 19, 2013
Sold by
Warmath Partners
Bought by
Ferguson R Barry and Summer Ferguson E
Current Estimated Value
Home Financials for this Owner
Home Financials are based on the most recent Mortgage that was taken out on this home.
Original Mortgage
$220,000
Outstanding Balance
$159,208
Interest Rate
3.96%
Mortgage Type
Commercial
Estimated Equity
$343,668
Purchase Details
Closed on
Nov 10, 2011
Sold by
Hanson Thomas D
Bought by
Warmath Partners
Purchase Details
Closed on
Feb 3, 1997
Sold by
Morgan Gary B
Bought by
Thomas Hanson
Purchase Details
Closed on
Oct 11, 1996
Bought by
Hanson Thoms D
Purchase Details
Closed on
Jun 28, 1990
Bought by
Morgan Gary B
Purchase Details
Closed on
Jan 11, 1990
Bought by
Cox Darryl & Assoc
Purchase Details
Closed on
Jan 30, 1989
Bought by
Cherry Hill Place
Purchase Details
Closed on
Dec 1, 1988
Bought by
Henry Harry L
Purchase Details
Closed on
May 27, 1988
Bought by
Cherry Hill Place
Create a Home Valuation Report for This Property
The Home Valuation Report is an in-depth analysis detailing your home's value as well as a comparison with similar homes in the area
Purchase History
| Date | Buyer | Sale Price | Title Company |
|---|---|---|---|
| Ferguson R Barry | $285,000 | -- | |
| Warmath Partners | $37,500 | -- | |
| Thomas Hanson | $232,000 | -- | |
| Hanson Thoms D | $232,000 | -- | |
| Morgan Gary B | $174,200 | -- | |
| Cox Darryl & Assoc | -- | -- | |
| Cherry Hill Place | -- | -- | |
| Henry Harry L | -- | -- | |
| Cherry Hill Place | -- | -- |
Source: Public Records
Mortgage History
| Date | Status | Borrower | Loan Amount |
|---|---|---|---|
| Open | Ferguson R Barry | $220,000 |
Source: Public Records
Tax History
| Year | Tax Paid | Tax Assessment Tax Assessment Total Assessment is a certain percentage of the fair market value that is determined by local assessors to be the total taxable value of land and additions on the property. | Land | Improvement |
|---|---|---|---|---|
| 2025 | $1,731 | $92,375 | $10,000 | $82,375 |
| 2024 | $1,731 | $92,375 | $10,000 | $82,375 |
| 2022 | $3,220 | $92,375 | $10,000 | $82,375 |
| 2021 | $3,141 | $72,850 | $7,250 | $65,600 |
| 2020 | $3,141 | $72,850 | $7,250 | $65,600 |
| 2019 | $3,141 | $72,850 | $7,250 | $65,600 |
| 2018 | $3,141 | $72,850 | $7,250 | $65,600 |
| 2017 | $2,999 | $67,975 | $7,250 | $60,725 |
| 2016 | $2,795 | $67,975 | $7,250 | $60,725 |
| 2015 | $2,795 | $67,975 | $7,250 | $60,725 |
| 2014 | $2,795 | $67,975 | $7,250 | $60,725 |
Source: Public Records
Map
Nearby Homes
- 49 Elmhurst Dr
- 119 Stonehenge Dr
- 39 Richland Cove
- 465 Shadow Ridge Dr
- 42 Wilmington Cove
- 60 Greendale Dr
- 59 Larkson Ln
- 9 Citrus Springs Cove
- 49 Northwyke Dr
- 107 Wyndchase Dr
- 114 Larkwood Dr
- 92 Northwyke Dr
- 127 Larkwood Dr
- 79 Swanbourne Cove
- 51 Crownpointe Cove
- 159 Larkwood Dr
- 72 Swanbourne Cove
- 37 Crownpointe Cove
- 290 Redfield Dr
- 54 Laurelwood Cove
- 83 Elmhurst Dr
- 69 Elmhurst Dr
- 138 Princeton Place
- 130 Princeton Place
- 146 Princeton Place
- 122 Princeton Place
- 59 Elmhurst Dr
- 219 Mcclellan Rd
- 86 Elmhurst Dr
- 114 Princeton Place
- 211 Mcclellan Rd
- 152 Princeton Place
- 133 Princeton Place
- 66 Elmhurst Dr
- 171 Princeton Place
- 125 Princeton Place
- 203 Mcclellan Rd
- 106 Princeton Place
- 117 Princeton Place
- 11 Stonehenge Dr
Your Personal Tour Guide
Ask me questions while you tour the home.