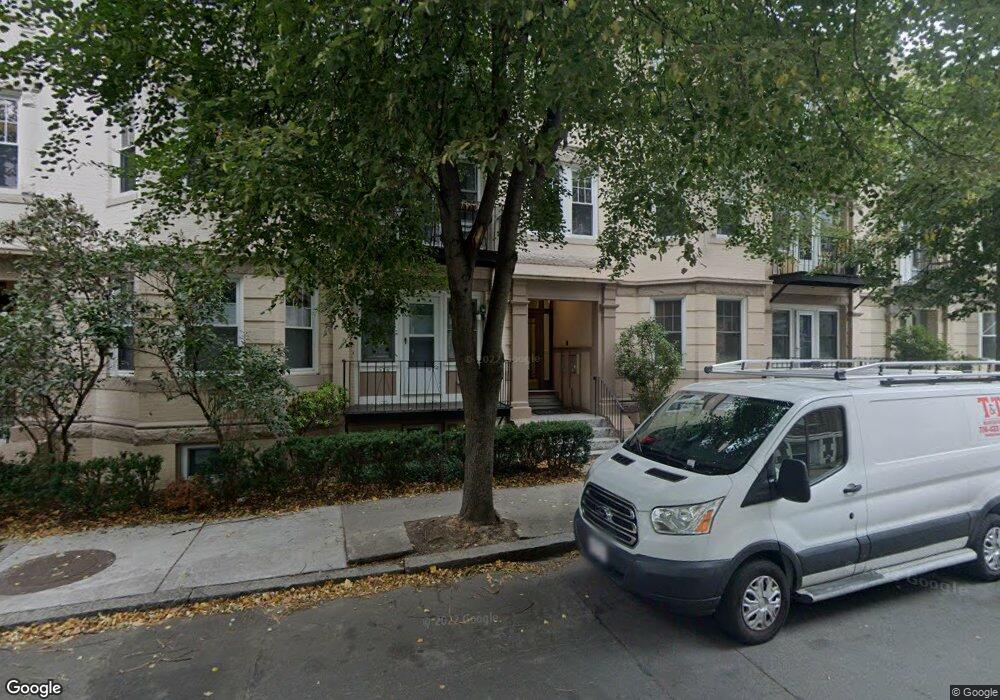
77 Gibbs St Unit 2 Brookline, MA 02446
Coolidge Corner NeighborhoodEstimated Value: $1,409,000 - $1,488,064
4
Beds
2
Baths
1,585
Sq Ft
$918/Sq Ft
Est. Value
About This Home
This home is located at 77 Gibbs St Unit 2, Brookline, MA 02446 and is currently estimated at $1,455,266, approximately $918 per square foot. 77 Gibbs St Unit 2 is a home located in Norfolk County with nearby schools including Match Charter Public School, New England Hebrew Academy, and Boston University Academy.
Ownership History
Date
Name
Owned For
Owner Type
Purchase Details
Closed on
Nov 1, 2016
Sold by
Hakimian Reza M and Hakimian Margaret B
Bought by
Hakimian Ret
Current Estimated Value
Purchase Details
Closed on
Feb 26, 2003
Sold by
Kay David K and Kay Maureen L
Bought by
Hakimian Margaret B and Hakimian Reza M
Home Financials for this Owner
Home Financials are based on the most recent Mortgage that was taken out on this home.
Original Mortgage
$452,000
Interest Rate
5.98%
Mortgage Type
Purchase Money Mortgage
Purchase Details
Closed on
Mar 8, 2000
Sold by
Berfield Tr Alan
Bought by
Leatherbarrow-Kay M and Kay David K
Home Financials for this Owner
Home Financials are based on the most recent Mortgage that was taken out on this home.
Original Mortgage
$350,400
Interest Rate
8.18%
Mortgage Type
Purchase Money Mortgage
Create a Home Valuation Report for This Property
The Home Valuation Report is an in-depth analysis detailing your home's value as well as a comparison with similar homes in the area
Home Values in the Area
Average Home Value in this Area
Purchase History
| Date | Buyer | Sale Price | Title Company |
|---|---|---|---|
| Hakimian Ret | -- | -- | |
| Hakimian Margaret B | $565,000 | -- | |
| Leatherbarrow-Kay M | $423,000 | -- |
Source: Public Records
Mortgage History
| Date | Status | Borrower | Loan Amount |
|---|---|---|---|
| Previous Owner | Hakimian Margaret B | $452,000 | |
| Previous Owner | Leatherbarrow-Kay M | $350,400 | |
| Closed | Leatherbarrow-Kay M | $43,800 |
Source: Public Records
Tax History Compared to Growth
Tax History
| Year | Tax Paid | Tax Assessment Tax Assessment Total Assessment is a certain percentage of the fair market value that is determined by local assessors to be the total taxable value of land and additions on the property. | Land | Improvement |
|---|---|---|---|---|
| 2025 | $11,748 | $1,190,300 | $0 | $1,190,300 |
| 2024 | $11,402 | $1,167,000 | $0 | $1,167,000 |
| 2023 | $11,244 | $1,127,800 | $0 | $1,127,800 |
| 2022 | $11,267 | $1,105,700 | $0 | $1,105,700 |
| 2021 | $10,729 | $1,094,800 | $0 | $1,094,800 |
| 2020 | $10,244 | $1,084,000 | $0 | $1,084,000 |
| 2019 | $9,674 | $1,032,400 | $0 | $1,032,400 |
| 2018 | $8,941 | $945,100 | $0 | $945,100 |
| 2017 | $8,646 | $875,100 | $0 | $875,100 |
| 2016 | $8,290 | $795,600 | $0 | $795,600 |
| 2015 | $7,724 | $723,200 | $0 | $723,200 |
| 2014 | $7,519 | $660,100 | $0 | $660,100 |
Source: Public Records
Map
Nearby Homes
- 116 Thorndike St
- 116 Thorndike St Unit 2
- 116 Thorndike St Unit 1
- 85 Naples Rd Unit B
- 85 Naples Rd Unit 2
- 95 Beals St Unit 2
- 11 Abbottsford Rd
- 5 Fiske Terrace
- 28 Verndale St
- 57 Brighton Ave Unit C
- 57 Brighton Ave Unit B
- 57 Brighton Ave Unit A
- 59 Brighton Ave Unit 1
- 233 Freeman St Unit 1
- 373 Harvard St Unit 1
- 107 Centre St Unit A
- 52 Babcock St Unit 6
- 58 Dwight St Unit 6
- 30 Glenville Ave Unit 1
- 99 Crowninshield Rd Unit 99
- 77 Gibbs St Unit 3
- 77 Gibbs St Unit 1
- 77 Gibbs St
- 77 Gibbs St Unit 33
- 156 Coolidge St
- 156 Coolidge St
- 156 Coolidge St Unit 3
- 156 Coolidge St Unit 2
- 156 Coolidge St Unit 3
- 156 Coolidge St Unit 30
- 156 Coolidge St Unit 1
- 79 Gibbs St Unit 3
- 79 Gibbs St Unit 2
- 79 Gibbs St Unit 1
- 79 Gibbs St Unit 79-2
- 79 Gibbs St
- 146 Coolidge St Unit 2
- 146 Coolidge St
- 146 Coolidge St
- 146 Coolidge St Unit 3