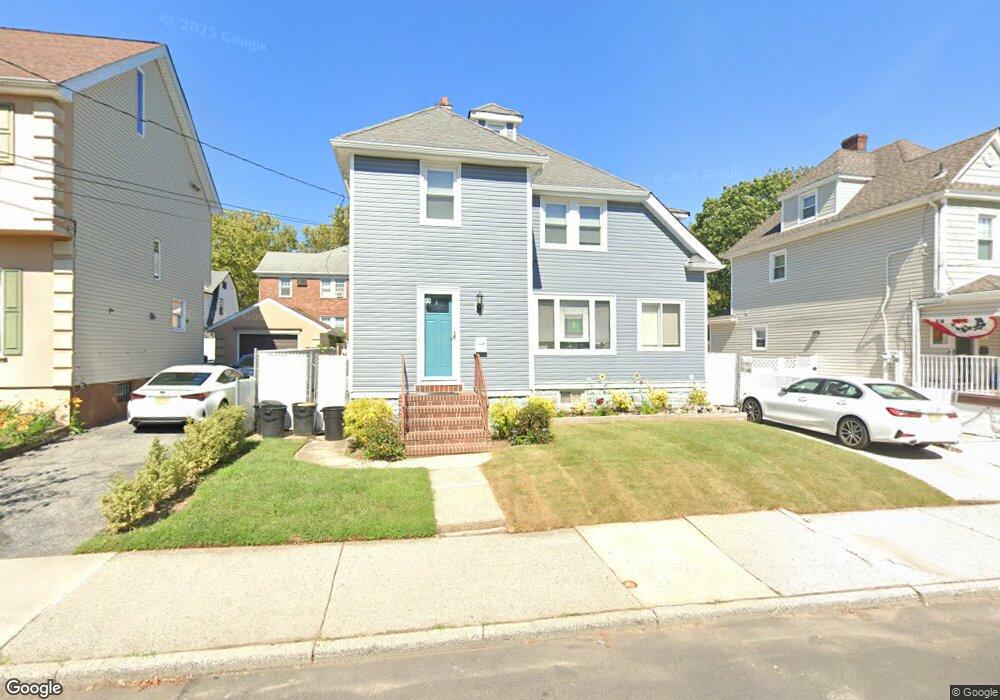
77 Locust Ave Staten Island, NY 10306
New Dorp NeighborhoodEstimated Value: $693,817 - $859,000
--
Bed
4
Baths
1,320
Sq Ft
$592/Sq Ft
Est. Value
About This Home
This home is located at 77 Locust Ave, Staten Island, NY 10306 and is currently estimated at $780,954, approximately $591 per square foot. 77 Locust Ave is a home located in Richmond County with nearby schools including P.S. 41 The Stephanie a Vierno School, Is 2 George L Egbert, and New Dorp High School.
Ownership History
Date
Name
Owned For
Owner Type
Purchase Details
Closed on
Jan 28, 2016
Sold by
Costa Louis F and Costa Jeanne M
Bought by
Costa Michael L and Costa Jennifer
Current Estimated Value
Home Financials for this Owner
Home Financials are based on the most recent Mortgage that was taken out on this home.
Original Mortgage
$372,000
Outstanding Balance
$296,744
Interest Rate
3.97%
Mortgage Type
New Conventional
Estimated Equity
$484,210
Create a Home Valuation Report for This Property
The Home Valuation Report is an in-depth analysis detailing your home's value as well as a comparison with similar homes in the area
Home Values in the Area
Average Home Value in this Area
Purchase History
| Date | Buyer | Sale Price | Title Company |
|---|---|---|---|
| Costa Michael L | $465,000 | First American Title Ins Co |
Source: Public Records
Mortgage History
| Date | Status | Borrower | Loan Amount |
|---|---|---|---|
| Open | Costa Michael L | $372,000 |
Source: Public Records
Tax History Compared to Growth
Tax History
| Year | Tax Paid | Tax Assessment Tax Assessment Total Assessment is a certain percentage of the fair market value that is determined by local assessors to be the total taxable value of land and additions on the property. | Land | Improvement |
|---|---|---|---|---|
| 2025 | $6,698 | $44,640 | $8,920 | $35,720 |
| 2024 | $6,698 | $36,480 | $10,916 | $25,564 |
| 2023 | $6,626 | $32,624 | $9,690 | $22,934 |
| 2022 | $6,233 | $34,260 | $11,940 | $22,320 |
| 2021 | $6,200 | $34,800 | $11,940 | $22,860 |
| 2020 | $5,883 | $31,620 | $11,940 | $19,680 |
| 2019 | $5,814 | $31,980 | $11,940 | $20,040 |
| 2018 | $5,542 | $27,187 | $10,799 | $16,388 |
| 2017 | $5,304 | $26,021 | $11,017 | $15,004 |
| 2016 | $4,908 | $24,549 | $9,674 | $14,875 |
| 2015 | $4,140 | $23,160 | $9,960 | $13,200 |
| 2014 | $4,140 | $23,160 | $9,960 | $13,200 |
Source: Public Records
Map
Nearby Homes
- 32 Otis Ave
- 77 Burbank Ave
- 24 Bancroft Ave
- 84 Bryant Ave
- 155 Burbank Ave
- 79 Cloister Place
- 2390 Richmond Rd
- 164 Burbank Ave
- 78 Cloister Place
- 109 Saint Stephens Place
- 2419 Richmond Rd
- 86 Fremont Ave
- 75 Jacques Ave
- 2136 Richmond Rd
- 25 4th St
- 35 4 St
- 20 8 St
- 25 Lincoln Ave
- 41 Lincoln Ave
- 142 Fremont Ave