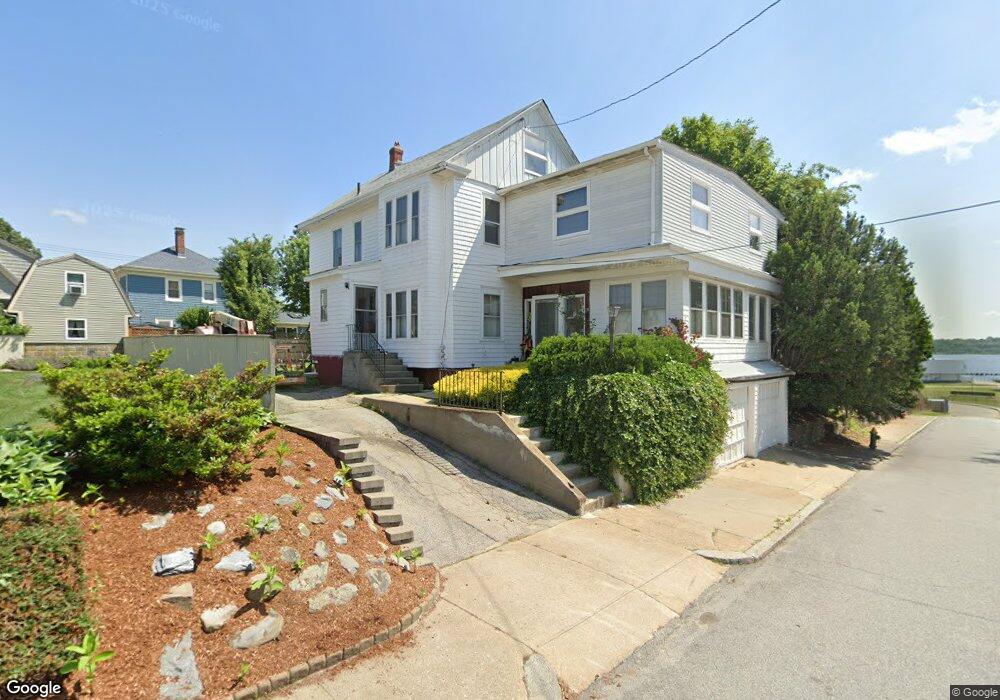
77 Narragansett St Cranston, RI 02905
Edgewood NeighborhoodEstimated Value: $581,000 - $741,000
6
Beds
2
Baths
3,630
Sq Ft
$177/Sq Ft
Est. Value
About This Home
This home is located at 77 Narragansett St, Cranston, RI 02905 and is currently estimated at $642,669, approximately $177 per square foot. 77 Narragansett St is a home located in Providence County with nearby schools including Edgewood Highland Elementary School, Park View Middle School, and Cranston High School East.
Ownership History
Date
Name
Owned For
Owner Type
Purchase Details
Closed on
May 26, 2022
Sold by
Yeretsian Aranoosh V
Bought by
Valentine Real Estate Llc
Current Estimated Value
Purchase Details
Closed on
Jun 28, 2019
Sold by
Yerestian Aranoosh V
Bought by
Key Partners Llc
Purchase Details
Closed on
Jun 8, 2017
Sold by
Reservoir Adventures L
Bought by
Cobble Hedge Llc
Purchase Details
Closed on
Jun 1, 2017
Sold by
Power Realty Rigp
Bought by
Yeretsian Aranoosh V
Purchase Details
Closed on
Oct 24, 2016
Sold by
Valentin Jose
Bought by
Yeretsian Aronoosh
Purchase Details
Closed on
Jun 20, 2016
Sold by
Rookies Real Estate Ll
Bought by
Valentin Jose
Purchase Details
Closed on
May 18, 2015
Sold by
Civil Process Svcs
Bought by
Yeretsian Aranoosh V
Purchase Details
Closed on
Jun 27, 2012
Sold by
Tax Assoc Llc
Bought by
Yeretsian Aranoosh V
Create a Home Valuation Report for This Property
The Home Valuation Report is an in-depth analysis detailing your home's value as well as a comparison with similar homes in the area
Home Values in the Area
Average Home Value in this Area
Purchase History
| Date | Buyer | Sale Price | Title Company |
|---|---|---|---|
| Valentine Real Estate Llc | $200,000 | None Available | |
| Key Partners Llc | $2,668 | -- | |
| Cobble Hedge Llc | $11,852 | -- | |
| Yeretsian Aranoosh V | $4,618 | -- | |
| Yeretsian Aranoosh V | $4,472 | -- | |
| Yeretsian Aronoosh | -- | -- | |
| Valentin Jose | -- | -- | |
| Yeretsian Aranoosh V | $3,490 | -- | |
| Yeretsian Aranoosh V | -- | -- |
Source: Public Records
Mortgage History
| Date | Status | Borrower | Loan Amount |
|---|---|---|---|
| Previous Owner | Yeretsian Aranoosh V | $220,000 | |
| Previous Owner | Yeretsian Aranoosh V | $70,200 |
Source: Public Records
Tax History Compared to Growth
Tax History
| Year | Tax Paid | Tax Assessment Tax Assessment Total Assessment is a certain percentage of the fair market value that is determined by local assessors to be the total taxable value of land and additions on the property. | Land | Improvement |
|---|---|---|---|---|
| 2025 | $6,235 | $449,200 | $107,400 | $341,800 |
| 2024 | $6,114 | $449,200 | $107,400 | $341,800 |
| 2023 | $5,817 | $307,800 | $74,100 | $233,700 |
| 2022 | $5,697 | $307,800 | $74,100 | $233,700 |
| 2021 | $5,540 | $307,800 | $74,100 | $233,700 |
| 2020 | $5,078 | $244,500 | $59,300 | $185,200 |
| 2019 | $5,078 | $244,500 | $59,300 | $185,200 |
| 2018 | $4,961 | $244,500 | $59,300 | $185,200 |
| 2017 | $5,035 | $219,500 | $66,700 | $152,800 |
| 2016 | $4,928 | $219,500 | $66,700 | $152,800 |
| 2015 | $4,928 | $219,500 | $66,700 | $152,800 |
| 2014 | $4,139 | $204,700 | $66,700 | $138,000 |
Source: Public Records
Map
Nearby Homes
- 67 Armington St
- 243 Bay View Ave
- 15 Wheeler Ave
- 88 Wentworth Ave
- 303 Narragansett St
- 358 Northup St
- 274 Montgomery Ave
- 114 Norwood Ave
- 236 Vermont Ave
- 208 California Ave
- 160 Ohio Ave
- 180 Ohio Ave
- 115 Ohio Ave
- 171 Norwood Ave
- 218 Indiana Ave
- 51 Columbia Ave
- 1291 Narragansett Blvd Unit 4
- 255 Ohio Ave
- 312 California Ave
- 177 Arnold Ave
- 116 Bay View Ave
- 97 Narragansett St
- 120 Bay View Ave
- 126 Bay View Ave
- 88 Narragansett St
- 130 Bay View Ave
- 70 Narragansett St
- 99 Narragansett St
- 132 Bay View Ave
- 66 Narragansett St
- 117 Bay View Ave
- 107 Bay View Ave
- 121 Bay View Ave
- 102 Narragansett St
- 125 Bay View Ave
- 81 Armington St
- 85 Armington St
- 60 Narragansett St
- 140 Bay View Ave
- 95 Bay View Ave