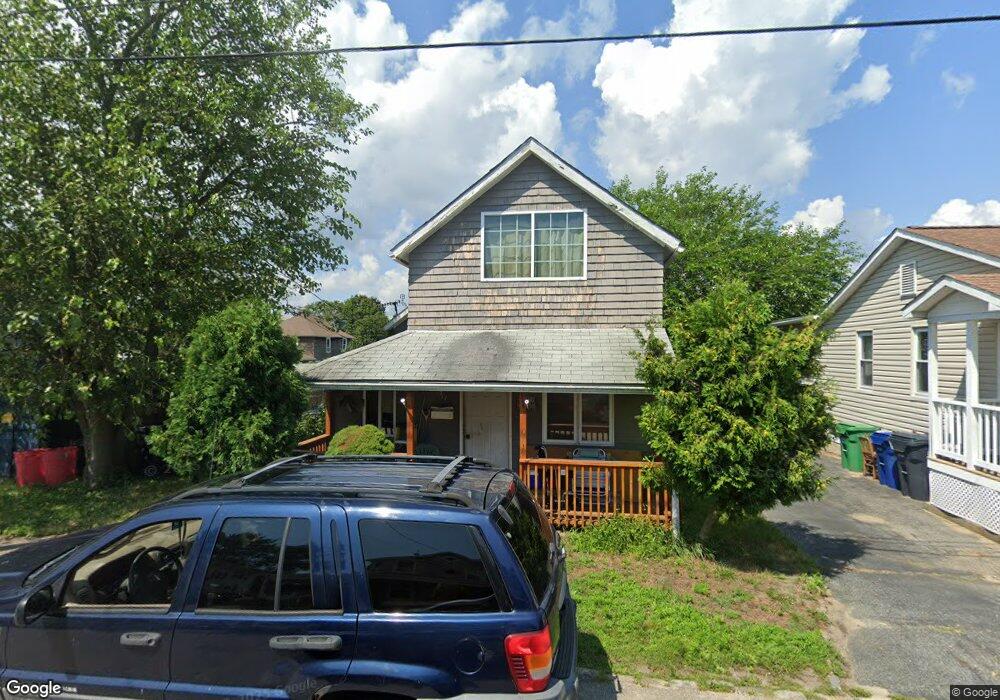
77 Oniska St Warwick, RI 02889
Oakland Beach NeighborhoodEstimated Value: $283,000 - $326,000
1
Bed
1
Bath
709
Sq Ft
$430/Sq Ft
Est. Value
About This Home
This home is located at 77 Oniska St, Warwick, RI 02889 and is currently estimated at $304,714, approximately $429 per square foot. 77 Oniska St is a home located in Kent County with nearby schools including Saint Kevin School and Bishop Hendricken High School.
Ownership History
Date
Name
Owned For
Owner Type
Purchase Details
Closed on
May 24, 1999
Sold by
Baron Robert A and Baron Catherine A
Bought by
Palumbo Heidi M
Current Estimated Value
Home Financials for this Owner
Home Financials are based on the most recent Mortgage that was taken out on this home.
Original Mortgage
$63,850
Outstanding Balance
$16,279
Interest Rate
6.88%
Mortgage Type
Purchase Money Mortgage
Estimated Equity
$288,435
Purchase Details
Closed on
Nov 1, 1993
Sold by
Mcinerney Joanne
Bought by
Baron Robert A and Baron Catherine
Home Financials for this Owner
Home Financials are based on the most recent Mortgage that was taken out on this home.
Original Mortgage
$66,300
Interest Rate
6.86%
Mortgage Type
Purchase Money Mortgage
Create a Home Valuation Report for This Property
The Home Valuation Report is an in-depth analysis detailing your home's value as well as a comparison with similar homes in the area
Home Values in the Area
Average Home Value in this Area
Purchase History
| Date | Buyer | Sale Price | Title Company |
|---|---|---|---|
| Palumbo Heidi M | $64,000 | -- | |
| Baron Robert A | $65,000 | -- |
Source: Public Records
Mortgage History
| Date | Status | Borrower | Loan Amount |
|---|---|---|---|
| Open | Baron Robert A | $63,850 | |
| Previous Owner | Baron Robert A | $66,300 |
Source: Public Records
Tax History Compared to Growth
Tax History
| Year | Tax Paid | Tax Assessment Tax Assessment Total Assessment is a certain percentage of the fair market value that is determined by local assessors to be the total taxable value of land and additions on the property. | Land | Improvement |
|---|---|---|---|---|
| 2024 | $2,767 | $191,200 | $70,900 | $120,300 |
| 2023 | $2,713 | $191,200 | $70,900 | $120,300 |
| 2022 | $2,401 | $128,200 | $40,300 | $87,900 |
| 2021 | $2,401 | $128,200 | $40,300 | $87,900 |
| 2020 | $2,401 | $128,200 | $40,300 | $87,900 |
| 2019 | $2,401 | $128,200 | $40,300 | $87,900 |
| 2018 | $1,828 | $87,900 | $37,400 | $50,500 |
| 2017 | $1,779 | $87,900 | $37,400 | $50,500 |
| 2016 | $1,779 | $87,900 | $37,400 | $50,500 |
| 2015 | $1,882 | $90,700 | $46,400 | $44,300 |
| 2014 | $1,819 | $90,700 | $46,400 | $44,300 |
| 2013 | $1,795 | $90,700 | $46,400 | $44,300 |
Source: Public Records
Map
Nearby Homes