
Seller's Agent in 2024
Kent Covington
CB Sea Coast Advantage MI
(843) 455-1700
12 in this area
136 Total Sales
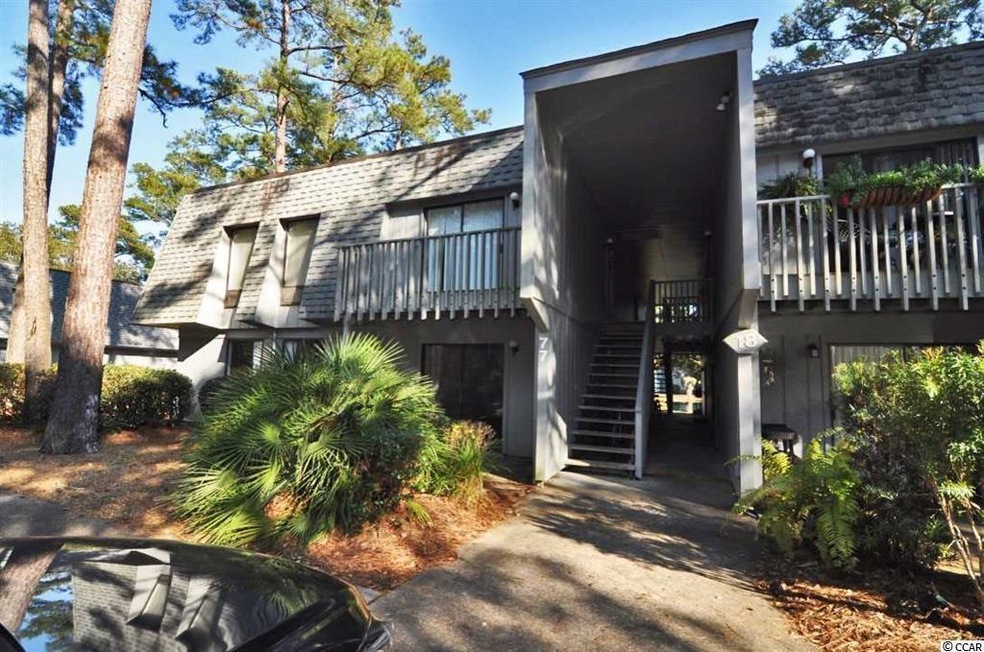
This home is located at 77 Salt Marsh Cir Unit 18, Pawleys Island, SC 29585 and is currently priced at $145,000, approximately $170 per square foot. This property was built in 1974. 77 Salt Marsh Cir Unit 18 is a home located in Georgetown County with nearby schools including Waccamaw Elementary School, Waccamaw Intermediate School, and Waccamaw Middle School.
Last Agent to Sell the Property
Sweet Water Realty, LLC License #18560 Listed on: 07/22/2021
| Date | Type | Sale Price | Title Company |
|---|---|---|---|
| Deed | $145,000 | None Available | |
| Quit Claim Deed | -- | None Available | |
| Deed | $120,000 | None Available | |
| Deed | $140,000 | None Available |
| Date | Status | Loan Amount | Loan Type |
|---|---|---|---|
| Previous Owner | $112,000 | Unknown | |
| Previous Owner | $112,000 | New Conventional |
| Date | Event | Price | Change | Sq Ft Price |
|---|---|---|---|---|
| 08/16/2024 08/16/24 | Sold | $204,500 | 0.0% | $227 / Sq Ft |
| 06/18/2024 06/18/24 | Off Market | $204,500 | -- | -- |
| 02/12/2024 02/12/24 | Price Changed | $209,900 | +16.6% | $233 / Sq Ft |
| 01/03/2024 01/03/24 | Sold | $180,000 | -16.9% | $212 / Sq Ft |
| 11/16/2023 11/16/23 | For Sale | $216,500 | 0.0% | $241 / Sq Ft |
| 08/22/2023 08/22/23 | Rented | $1,450 | 0.0% | -- |
| 08/07/2023 08/07/23 | For Sale | $195,000 | 0.0% | $229 / Sq Ft |
| 08/07/2023 08/07/23 | For Rent | $1,450 | 0.0% | -- |
| 10/12/2022 10/12/22 | Sold | $208,000 | -0.4% | $231 / Sq Ft |
| 07/19/2022 07/19/22 | Price Changed | $208,900 | +0.4% | $232 / Sq Ft |
| 07/18/2022 07/18/22 | For Sale | $208,000 | +23.8% | $231 / Sq Ft |
| 03/11/2022 03/11/22 | Sold | $168,000 | +12.0% | $199 / Sq Ft |
| 01/05/2022 01/05/22 | Sold | $150,000 | -10.7% | $178 / Sq Ft |
| 01/05/2022 01/05/22 | For Sale | $168,000 | +8.4% | $199 / Sq Ft |
| 11/05/2021 11/05/21 | For Sale | $155,000 | +6.9% | $184 / Sq Ft |
| 08/31/2021 08/31/21 | Sold | $145,000 | 0.0% | $170 / Sq Ft |
| 07/22/2021 07/22/21 | Pending | -- | -- | -- |
| 07/22/2021 07/22/21 | For Sale | $145,000 | +14.2% | $170 / Sq Ft |
| 05/18/2021 05/18/21 | Sold | $127,000 | -5.9% | $149 / Sq Ft |
| 05/14/2021 05/14/21 | Sold | $135,000 | +3.9% | $159 / Sq Ft |
| 04/14/2021 04/14/21 | Price Changed | $129,900 | -7.1% | $153 / Sq Ft |
| 02/25/2021 02/25/21 | For Sale | $139,900 | -3.5% | $165 / Sq Ft |
| 02/07/2021 02/07/21 | For Sale | $145,000 | +34.3% | $171 / Sq Ft |
| 05/29/2020 05/29/20 | Sold | $108,000 | -9.2% | $119 / Sq Ft |
| 03/02/2020 03/02/20 | For Sale | $119,000 | +10.2% | $131 / Sq Ft |
| 02/24/2020 02/24/20 | Sold | $108,000 | -3.6% | $127 / Sq Ft |
| 01/31/2020 01/31/20 | For Sale | $112,000 | +3.7% | $132 / Sq Ft |
| 01/31/2020 01/31/20 | Off Market | $108,000 | -- | -- |
| 12/30/2019 12/30/19 | Price Changed | $119,000 | -0.8% | $131 / Sq Ft |
| 12/17/2019 12/17/19 | Price Changed | $120,000 | -1.6% | $132 / Sq Ft |
| 11/15/2019 11/15/19 | Price Changed | $122,000 | -1.6% | $134 / Sq Ft |
| 11/04/2019 11/04/19 | Price Changed | $124,000 | -0.8% | $136 / Sq Ft |
| 10/27/2019 10/27/19 | Price Changed | $125,000 | -2.3% | $137 / Sq Ft |
| 10/20/2019 10/20/19 | Price Changed | $127,900 | -1.5% | $140 / Sq Ft |
| 10/07/2019 10/07/19 | Price Changed | $129,900 | -3.1% | $143 / Sq Ft |
| 09/03/2019 09/03/19 | For Sale | $134,000 | 0.0% | $147 / Sq Ft |
| 09/03/2019 09/03/19 | Price Changed | $134,000 | +24.1% | $147 / Sq Ft |
| 07/30/2019 07/30/19 | Off Market | $108,000 | -- | -- |
| 07/25/2019 07/25/19 | Price Changed | $104,500 | -3.7% | $115 / Sq Ft |
| 06/10/2019 06/10/19 | Price Changed | $108,500 | -0.5% | $119 / Sq Ft |
| 05/16/2019 05/16/19 | Price Changed | $109,000 | -5.2% | $120 / Sq Ft |
| 04/22/2019 04/22/19 | Price Changed | $115,000 | -3.4% | $126 / Sq Ft |
| 03/22/2019 03/22/19 | For Sale | $119,000 | +40.0% | $131 / Sq Ft |
| 07/27/2017 07/27/17 | Sold | $85,000 | -7.6% | $98 / Sq Ft |
| 06/28/2017 06/28/17 | Pending | -- | -- | -- |
| 01/04/2017 01/04/17 | For Sale | $92,000 | +2.2% | $106 / Sq Ft |
| 06/29/2016 06/29/16 | Sold | $89,995 | -2.7% | $106 / Sq Ft |
| 04/29/2016 04/29/16 | Pending | -- | -- | -- |
| 04/20/2016 04/20/16 | For Sale | $92,500 | +21.7% | $109 / Sq Ft |
| 10/22/2014 10/22/14 | Sold | $76,000 | -7.9% | $80 / Sq Ft |
| 09/17/2014 09/17/14 | Pending | -- | -- | -- |
| 06/04/2014 06/04/14 | For Sale | $82,500 | -6.8% | $87 / Sq Ft |
| 07/03/2013 07/03/13 | Sold | $88,500 | -11.1% | $93 / Sq Ft |
| 06/19/2013 06/19/13 | Pending | -- | -- | -- |
| 09/26/2012 09/26/12 | For Sale | $99,500 | -- | $105 / Sq Ft |
| Year | Tax Paid | Tax Assessment Tax Assessment Total Assessment is a certain percentage of the fair market value that is determined by local assessors to be the total taxable value of land and additions on the property. | Land | Improvement |
|---|---|---|---|---|
| 2024 | $2,084 | $8,100 | $0 | $8,100 |
| 2023 | $2,084 | $8,100 | $0 | $8,100 |
| 2022 | $1,935 | $8,100 | $0 | $8,100 |
| 2021 | $531 | $0 | $0 | $0 |
| 2020 | $501 | $4,400 | $0 | $4,400 |
| 2019 | $437 | $3,600 | $0 | $3,600 |
| 2018 | $447 | $0 | $0 | $0 |
| 2017 | $373 | $36,000 | $0 | $0 |
| 2016 | $368 | $3,600 | $0 | $0 |
| 2015 | $376 | $0 | $0 | $0 |
| 2014 | $376 | $90,000 | $0 | $90,000 |
| 2012 | -- | $90,000 | $0 | $90,000 |
Seller's Agent in 2024
Kent Covington
CB Sea Coast Advantage MI
(843) 455-1700
12 in this area
136 Total Sales
Seller's Agent in 2024
Jim Kay
Litchfield Real Estate
(843) 385-7366
8 in this area
20 Total Sales
Buyer's Agent in 2024
Phil Tabakelis
Surfside Realty Co Inc
(704) 277-0109
1 in this area
56 Total Sales
J
Buyer's Agent in 2024
James Mike Frazier II
Keller Williams The Forturro G
G
Seller's Agent in 2023
Gwenney Grant
The Dieter Company
(843) 237-9800
Seller's Agent in 2022
Lisa Shults
R & R Specialists, LLC
(828) 461-7611
5 in this area
60 Total Sales
Source: Coastal Carolinas Association of REALTORS®
MLS Number: 2120200
APN: 04-0143-069-01-00
Disclaimer: Certain information contained herein is derived from information provided by parties other than Homes.com. All information provided is deemed reliable, but is not guaranteed to be accurate and should be independently verified.
![]() Provided courtesy of the Coastal Carolinas MLS. Copyright 2025 of the Coastal Carolinas MLS. All rights reserved. Information is provided exclusively for consumers' personal, non-commercial use, and may not be used for any purpose other than to identify prospective properties consumers may be interested in purchasing, and that the data is deemed reliable but is not guaranteed accurate by the Coastal Carolinas MLS.
Provided courtesy of the Coastal Carolinas MLS. Copyright 2025 of the Coastal Carolinas MLS. All rights reserved. Information is provided exclusively for consumers' personal, non-commercial use, and may not be used for any purpose other than to identify prospective properties consumers may be interested in purchasing, and that the data is deemed reliable but is not guaranteed accurate by the Coastal Carolinas MLS.