
77 Tyler St Unit 2 Boston, MA 02111
Chinatown Neighborhood
2
Beds
1
Bath
524
Sq Ft
$360/mo
HOA Fee
Highlights
- Medical Services
- 5-minute walk to New England Medical Center Station
- Solid Surface Countertops
- Property is near public transit
- Wood Flooring
- 1-minute walk to One Greenway Park
About This Home
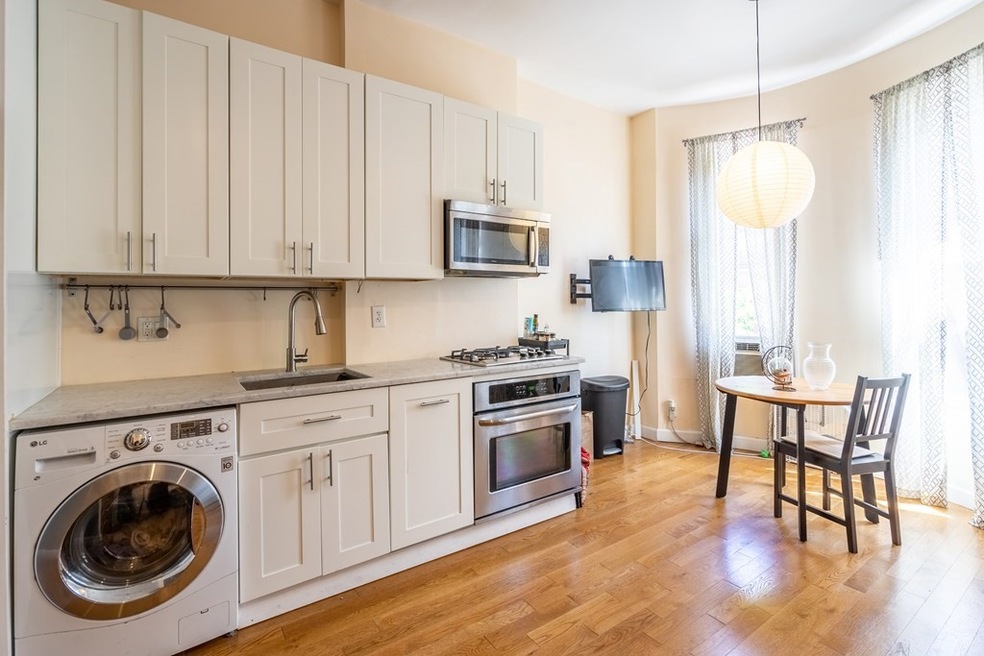
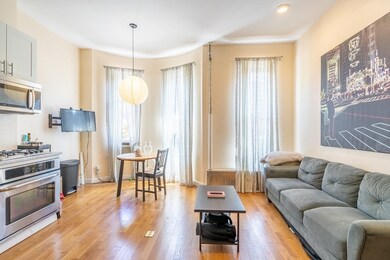
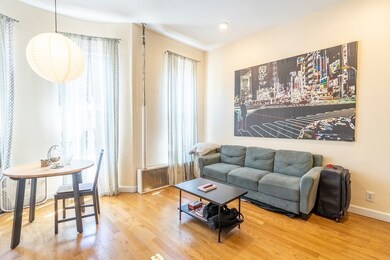
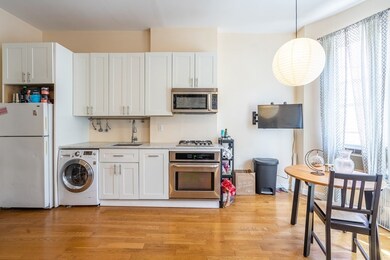
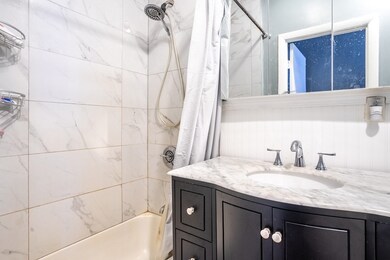
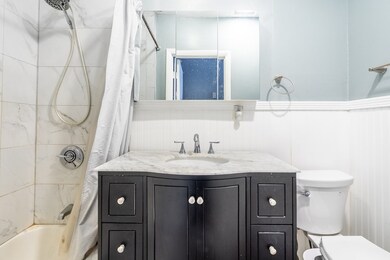
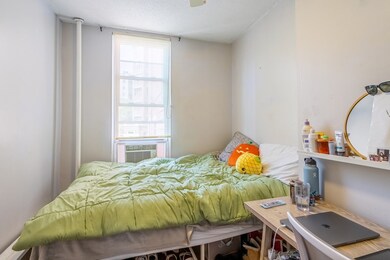
As of August 2023A terrific modern and contemporary apartment in Downtown and Chinatown location. This two bedroom, one bathroom, unit features an open concept living room, and eat-in kitchen with marble countertops and appliances including a dishwasher, disposal, and microwave. It also features high ceilings, ceiling fans and lights, air conditioning, ample closet space, and in unit washer and dryer. There is hardwood flooring throughout the majority of the space. Hot and cold water and heat included. On street parking. Close and convenient distance to the Orange, Green and Red line stations. Open House Sat & Sun (05/20 & 05/21) 11AM - 1PM
Property Details
Home Type
- Condominium
Est. Annual Taxes
- $3,525
Year Built
- Built in 1899
HOA Fees
- $360 Monthly HOA Fees
Home Design
- Brick Exterior Construction
- Shingle Roof
Interior Spaces
- 524 Sq Ft Home
- 1-Story Property
Kitchen
- Stove
- Range
- Microwave
- Dishwasher
- Solid Surface Countertops
Flooring
- Wood
- Ceramic Tile
Bedrooms and Bathrooms
- 2 Bedrooms
- Primary bedroom located on second floor
- 1 Full Bathroom
- Bathtub with Shower
Laundry
- Laundry on upper level
- Dryer
- Washer
Location
- Property is near public transit
- Property is near schools
Utilities
- Window Unit Cooling System
- Baseboard Heating
- Hot Water Heating System
- Natural Gas Connected
- Gas Water Heater
Listing and Financial Details
- Assessor Parcel Number W:03 P:05108 S:006,3366508
Community Details
Overview
- Association fees include heat, water, sewer, insurance, maintenance structure
- 6 Units
Amenities
- Medical Services
- Shops
Ownership History
Date
Name
Owned For
Owner Type
Purchase Details
Closed on
Jan 27, 2025
Sold by
Lu Ping
Bought by
77-2 Tyler St Rt and Lu
Current Estimated Value
Purchase Details
Closed on
Jan 18, 2006
Sold by
Cheung Kwok W
Bought by
Yao Chai S and Yao Tham M
Home Financials for this Owner
Home Financials are based on the most recent Mortgage that was taken out on this home.
Original Mortgage
$261,000
Interest Rate
6.33%
Mortgage Type
Purchase Money Mortgage
Similar Homes in the area
Create a Home Valuation Report for This Property
The Home Valuation Report is an in-depth analysis detailing your home's value as well as a comparison with similar homes in the area
Home Values in the Area
Average Home Value in this Area
Purchase History
| Date | Type | Sale Price | Title Company |
|---|---|---|---|
| Quit Claim Deed | -- | None Available | |
| Quit Claim Deed | -- | None Available | |
| Deed | $290,000 | -- | |
| Deed | $290,000 | -- |
Source: Public Records
Mortgage History
| Date | Status | Loan Amount | Loan Type |
|---|---|---|---|
| Previous Owner | $279,000 | Purchase Money Mortgage | |
| Previous Owner | $283,500 | New Conventional | |
| Previous Owner | $261,000 | Purchase Money Mortgage |
Source: Public Records
Property History
| Date | Event | Price | Change | Sq Ft Price |
|---|---|---|---|---|
| 08/02/2023 08/02/23 | Sold | $465,000 | -3.1% | $887 / Sq Ft |
| 06/19/2023 06/19/23 | Pending | -- | -- | -- |
| 05/31/2023 05/31/23 | Price Changed | $480,000 | -1.0% | $916 / Sq Ft |
| 05/16/2023 05/16/23 | For Sale | $485,000 | +54.0% | $926 / Sq Ft |
| 12/18/2015 12/18/15 | Sold | $315,000 | -3.1% | $601 / Sq Ft |
| 10/28/2015 10/28/15 | Pending | -- | -- | -- |
| 10/22/2015 10/22/15 | For Sale | $325,000 | +3.2% | $620 / Sq Ft |
| 08/18/2015 08/18/15 | Off Market | $315,000 | -- | -- |
| 08/18/2015 08/18/15 | Pending | -- | -- | -- |
| 07/27/2015 07/27/15 | For Sale | $325,000 | -- | $620 / Sq Ft |
Source: MLS Property Information Network (MLS PIN)
Tax History Compared to Growth
Tax History
| Year | Tax Paid | Tax Assessment Tax Assessment Total Assessment is a certain percentage of the fair market value that is determined by local assessors to be the total taxable value of land and additions on the property. | Land | Improvement |
|---|---|---|---|---|
| 2025 | $4,281 | $369,700 | $0 | $369,700 |
| 2024 | $3,722 | $341,500 | $0 | $341,500 |
| 2023 | $3,525 | $328,200 | $0 | $328,200 |
| 2022 | $3,502 | $321,900 | $0 | $321,900 |
| 2021 | $3,367 | $315,600 | $0 | $315,600 |
| 2020 | $3,294 | $311,900 | $0 | $311,900 |
| 2019 | $3,130 | $297,000 | $0 | $297,000 |
| 2018 | $3,082 | $294,100 | $0 | $294,100 |
| 2017 | $2,996 | $282,900 | $0 | $282,900 |
| 2016 | $2,969 | $269,895 | $0 | $269,895 |
| 2015 | $2,805 | $231,600 | $0 | $231,600 |
| 2014 | $2,673 | $212,500 | $0 | $212,500 |
Source: Public Records
Agents Affiliated with this Home
-
Angela Cui
Seller's Agent in 2023
Angela Cui
Keller Williams Realty
(857) 498-7037
2 in this area
384 Total Sales
-
Jie Lian
J
Seller Co-Listing Agent in 2023
Jie Lian
Keller Williams Realty
(617) 407-4611
2 in this area
38 Total Sales
-
M
Seller's Agent in 2015
Move 2 Boston Group
William Raveis R.E. & Home Services
-
Nathaniel Goodrich
N
Buyer's Agent in 2015
Nathaniel Goodrich
Compass
6 Total Sales
Map
Source: MLS Property Information Network (MLS PIN)
MLS Number: 73111887
APN: CBOS-000000-000003-005108-000006
Disclaimer: Certain information contained herein is derived from information provided by parties other than Homes.com. All information provided is deemed reliable, but is not guaranteed to be accurate and should be independently verified.
![]() The property listing data and information, or the Images, set forth herein were provided to MLS Property Information Network, Inc. from third party sources, including sellers, lessors and public records, and were compiled by MLS Property Information Network, Inc. The property listing data and information, and the Images, are for the personal, non-commercial use of consumers having a good faith interest in purchasing or leasing listed properties of the type displayed to them and may not be used for any purpose other than to identify prospective properties which such consumers may have a good faith interest in purchasing or leasing. MLS Property Information Network, Inc. and its subscribers disclaim any and all representations and warranties as to the accuracy of the property listing data and information, or as to the accuracy of any of the Images, set forth herein.
The property listing data and information, or the Images, set forth herein were provided to MLS Property Information Network, Inc. from third party sources, including sellers, lessors and public records, and were compiled by MLS Property Information Network, Inc. The property listing data and information, and the Images, are for the personal, non-commercial use of consumers having a good faith interest in purchasing or leasing listed properties of the type displayed to them and may not be used for any purpose other than to identify prospective properties which such consumers may have a good faith interest in purchasing or leasing. MLS Property Information Network, Inc. and its subscribers disclaim any and all representations and warranties as to the accuracy of the property listing data and information, or as to the accuracy of any of the Images, set forth herein.
Nearby Homes
- 1 Nassau St Unit 1308
- 1 Nassau St Unit PH10
- 121-123 Beach St Unit 303
- 121-123 Beach St Unit 801
- 55 Lagrange St Unit PH21E
- 55 Lagrange St Unit 1507
- 55 Lagrange St Unit 902
- 55 Lagrange St Unit 905
- 55 Lagrange St Unit 901
- 55 Lagrange St Unit 710
- 55 Lagrange St Unit 909
- 55 Lagrange St Unit 707
- 55 Lagrange St Unit 808
- 210 South St Unit 24
- 210 South St Unit 112
- 210 South St Unit 92
- 210 South St Unit 103
- 107 South St Unit 2A
- 110 Stuart St Unit 18A
- 110 Stuart St Unit 24H