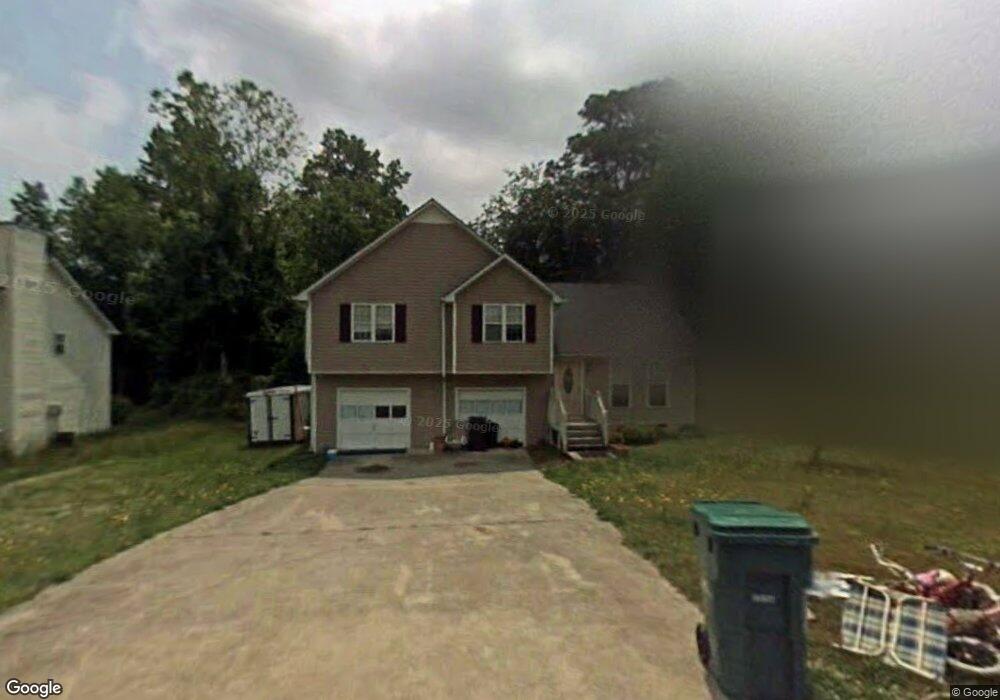
77 Waterford Dr Villa Rica, GA 30180
Estimated Value: $246,000 - $255,271
3
Beds
2
Baths
1,272
Sq Ft
$198/Sq Ft
Est. Value
About This Home
This home is located at 77 Waterford Dr, Villa Rica, GA 30180 and is currently estimated at $251,318, approximately $197 per square foot. 77 Waterford Dr is a home located in Carroll County with nearby schools including Villa Rica Elementary School, Villa Rica Middle School, and Villa Rica High School.
Ownership History
Date
Name
Owned For
Owner Type
Purchase Details
Closed on
Sep 26, 2019
Sold by
Sfr Jv 1 Property Llc
Bought by
Sfr Jv 1 2019 1 Borrower Llc
Current Estimated Value
Purchase Details
Closed on
Sep 28, 2018
Sold by
Offerpad Spvborrower1 Llc
Bought by
Sfr Jv 1 Property Llc
Purchase Details
Closed on
Aug 14, 2018
Sold by
Neese Elijah
Bought by
Offerpad Spvborrower1 Llc
Purchase Details
Closed on
Jun 29, 2009
Sold by
Sec Dept Of Housing
Bought by
Neese Elijah R
Purchase Details
Closed on
Oct 7, 2008
Sold by
Not Provided
Bought by
Neese Elijah R
Purchase Details
Closed on
Mar 26, 1999
Sold by
Douglas County Bank
Bought by
Mabe Tammy Lynn
Purchase Details
Closed on
Aug 13, 1996
Bought by
Douglas County Bank
Purchase Details
Closed on
Jun 15, 1995
Bought by
Prestige Builders In
Create a Home Valuation Report for This Property
The Home Valuation Report is an in-depth analysis detailing your home's value as well as a comparison with similar homes in the area
Home Values in the Area
Average Home Value in this Area
Purchase History
| Date | Buyer | Sale Price | Title Company |
|---|---|---|---|
| Sfr Jv 1 2019 1 Borrower Llc | -- | -- | |
| Sfr Jv 1 Property Llc | $140,000 | -- | |
| Offerpad Spvborrower1 Llc | $126,436 | -- | |
| Neese Elijah R | $70,200 | -- | |
| Neese Elijah R | $72,140 | -- | |
| Neese Elijah R | $72,140 | -- | |
| Georgia Housing & Finance Au | $72,140 | -- | |
| Mabe Tammy Lynn | $80,000 | -- | |
| Douglas County Bank | $68,400 | -- | |
| Prestige Builders In | -- | -- |
Source: Public Records
Tax History Compared to Growth
Tax History
| Year | Tax Paid | Tax Assessment Tax Assessment Total Assessment is a certain percentage of the fair market value that is determined by local assessors to be the total taxable value of land and additions on the property. | Land | Improvement |
|---|---|---|---|---|
| 2024 | $2,426 | $85,983 | $7,200 | $78,783 |
| 2023 | $2,426 | $79,182 | $7,200 | $71,982 |
| 2022 | $2,035 | $64,969 | $7,200 | $57,769 |
| 2021 | $1,809 | $56,732 | $7,200 | $49,532 |
| 2020 | $1,633 | $51,165 | $7,200 | $43,965 |
| 2019 | $1,507 | $47,672 | $7,200 | $40,472 |
| 2018 | $1,184 | $43,275 | $7,200 | $36,075 |
| 2017 | $1,016 | $35,738 | $5,600 | $30,138 |
| 2016 | $1,021 | $35,738 | $5,600 | $30,138 |
| 2015 | $923 | $30,033 | $8,000 | $22,034 |
| 2014 | $803 | $26,361 | $8,000 | $18,361 |
Source: Public Records
Map
Nearby Homes
- 902 N Lassetter Cir
- 1024 Topaz Ln
- 309 Winton Way
- 414 Towson St
- 412 Towson St
- Cosmos Plan at The Emery
- 313 Winton Way
- 605 Rocky Branch Rd
- 1040 Merritt Dr Unit 21
- 1028 Merritt Dr
- 1033 Merritt Dr
- 1014 Merritt Dr
- 1014 Merritt Dr Unit 8
- 1035 Merritt Dr
- 1028 Merritt Dr Unit 15
- 1037 Merritt Dr Unit 93
- 1026 Merritt Dr Unit 14
- 1022 Merritt Dr Unit 12
- 1018 Merritt Dr Unit 10
- 1039 Merritt Dr Unit 92
- 85 Waterford Dr
- 31 Melleray Ct
- 19 Melleray Ct
- 93 Waterford Dr
- 29 Cashel Ct
- 0 Waterford Dr Unit 7120681
- 0 Waterford Dr Unit 8259729
- 0 Waterford Dr Unit 7193086
- 0 Waterford Dr Unit 7392254
- 0 Waterford Dr
- 11 Melleray Ct
- 49 Melleray Ct
- 49 Melleray Ct
- 82 Waterford Dr
- 55 Waterford Dr
- 90 Waterford Dr
- 0 Cashel Ct Unit 8590815
- 100 Waterford Dr
- 993 S Lassetter Cir
- 26 Melleray Ct