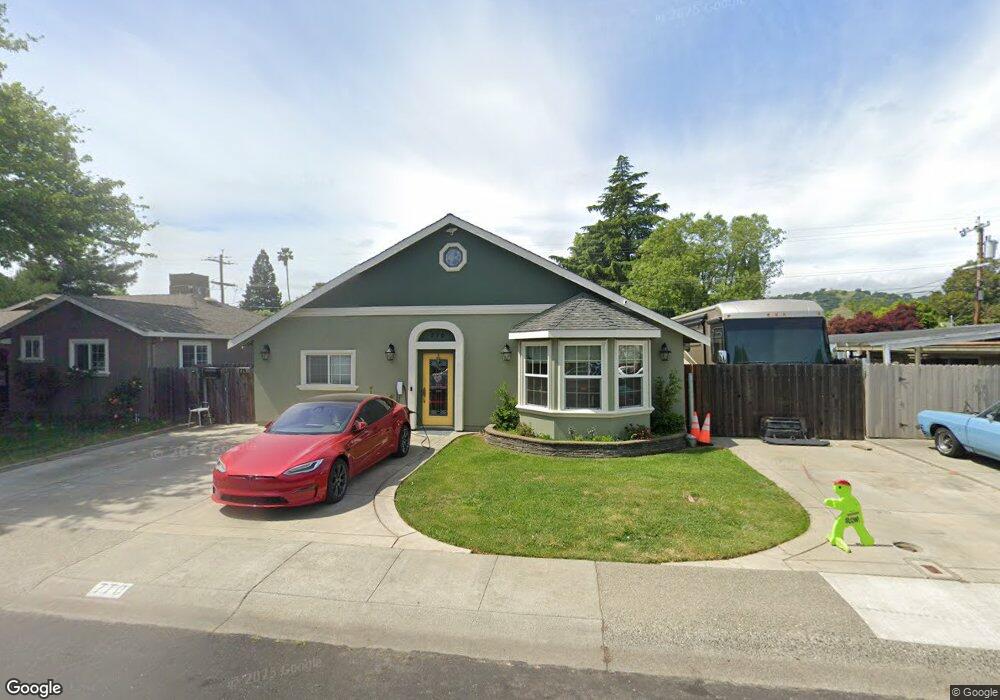
770 Azalea Way Vacaville, CA 95688
Estimated Value: $511,883 - $562,000
4
Beds
2
Baths
1,486
Sq Ft
$366/Sq Ft
Est. Value
About This Home
This home is located at 770 Azalea Way, Vacaville, CA 95688 and is currently estimated at $543,221, approximately $365 per square foot. 770 Azalea Way is a home located in Solano County with nearby schools including Alamo Elementary School, Orchard Elementary School, and Willis Jepson Middle School.
Ownership History
Date
Name
Owned For
Owner Type
Purchase Details
Closed on
Oct 20, 2022
Sold by
Riley Walter Dan and Riley Shawna Lee
Bought by
Riley Family Trust
Current Estimated Value
Purchase Details
Closed on
Sep 5, 2000
Sold by
Dan Riley W
Bought by
Riley W Dan and Riley Shawna L
Home Financials for this Owner
Home Financials are based on the most recent Mortgage that was taken out on this home.
Original Mortgage
$25,000
Interest Rate
7.9%
Mortgage Type
Stand Alone Second
Purchase Details
Closed on
Jan 21, 1998
Sold by
Riley Shawna L
Bought by
Riley W Dan
Home Financials for this Owner
Home Financials are based on the most recent Mortgage that was taken out on this home.
Original Mortgage
$112,787
Interest Rate
7.05%
Mortgage Type
FHA
Purchase Details
Closed on
Jan 14, 1994
Sold by
Riley Shawna L
Bought by
Riley W Dan
Home Financials for this Owner
Home Financials are based on the most recent Mortgage that was taken out on this home.
Original Mortgage
$110,776
Interest Rate
7.16%
Mortgage Type
FHA
Create a Home Valuation Report for This Property
The Home Valuation Report is an in-depth analysis detailing your home's value as well as a comparison with similar homes in the area
Home Values in the Area
Average Home Value in this Area
Purchase History
| Date | Buyer | Sale Price | Title Company |
|---|---|---|---|
| Riley Family Trust | -- | -- | |
| Riley W Dan | -- | United Independent Title Ins | |
| Riley W Dan | -- | Placer Title Company | |
| Riley W Dan | -- | Placer Title Company | |
| Riley W Dan | $110,000 | Placer Title Company |
Source: Public Records
Mortgage History
| Date | Status | Borrower | Loan Amount |
|---|---|---|---|
| Previous Owner | Riley W Dan | $25,000 | |
| Previous Owner | Riley W Dan | $112,787 | |
| Previous Owner | Riley W Dan | $110,776 |
Source: Public Records
Tax History Compared to Growth
Tax History
| Year | Tax Paid | Tax Assessment Tax Assessment Total Assessment is a certain percentage of the fair market value that is determined by local assessors to be the total taxable value of land and additions on the property. | Land | Improvement |
|---|---|---|---|---|
| 2025 | $3,500 | $311,108 | $67,986 | $243,122 |
| 2024 | $3,500 | $305,008 | $66,653 | $238,355 |
| 2023 | $3,416 | $299,029 | $65,347 | $233,682 |
| 2022 | $3,326 | $293,166 | $64,066 | $229,100 |
| 2021 | $3,330 | $287,418 | $62,810 | $224,608 |
| 2020 | $3,285 | $284,471 | $62,166 | $222,305 |
| 2019 | $3,227 | $278,895 | $60,948 | $217,947 |
| 2018 | $3,190 | $273,427 | $59,753 | $213,674 |
| 2017 | $3,082 | $268,067 | $58,582 | $209,485 |
| 2016 | $3,062 | $262,812 | $57,434 | $205,378 |
| 2015 | $3,022 | $258,866 | $56,572 | $202,294 |
| 2014 | $2,830 | $253,796 | $55,464 | $198,332 |
Source: Public Records
Map
Nearby Homes
- 818 Lovers Ln
- 721 Camellia Way
- 680 S Orchard Ave
- 149 Fairoaks Dr
- 970 El Camino Ave Unit 3
- 376 Bishop Dr
- 0 Merchant St Unit 325089259
- 569 Alamo Dr
- 571 Nottingham Dr
- 149 Mason St
- 491 Rosso Ct
- 325 Gabiano Ct
- 253 W Kendal St
- 491 Buck Ave
- 124 Main St
- 101 Main St
- 678 Claremont Dr
- 632 Cordelia Cir
- 512 Davis St
- 100 Ramona St
- 780 Azalea Way
- 760 Azalea Way
- 771 S Orchard Ave
- 761 S Orchard Ave
- 750 Azalea Way
- 781 S Orchard Ave
- 790 Azalea Way
- 771 Azalea Way
- 781 Azalea Way
- 751 S Orchard Ave
- 761 Azalea Way
- 791 S Orchard Ave
- 740 Azalea Way
- 791 Azalea Way
- 751 Azalea Way
- 741 S Orchard Ave
- 741 Azalea Way
- 730 Azalea Way
- 770 Camellia Way
- 780 Camellia Way