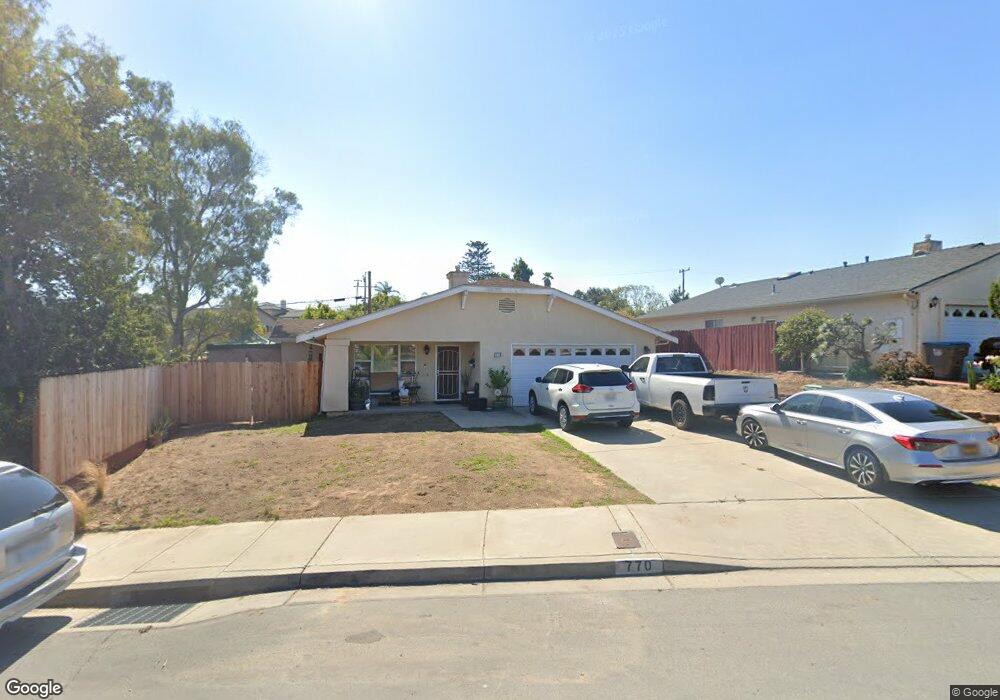
770 Bristlecone Ln Nipomo, CA 93444
Estimated Value: $637,000 - $734,000
4
Beds
2
Baths
1,324
Sq Ft
$521/Sq Ft
Est. Value
About This Home
This home is located at 770 Bristlecone Ln, Nipomo, CA 93444 and is currently estimated at $689,891, approximately $521 per square foot. 770 Bristlecone Ln is a home located in San Luis Obispo County with nearby schools including Dana Elementary School, Mesa Middle School, and Nipomo High School.
Ownership History
Date
Name
Owned For
Owner Type
Purchase Details
Closed on
Feb 12, 2025
Sold by
Flores Sylvia
Bought by
Sylvia Flores Trust and Flores
Current Estimated Value
Purchase Details
Closed on
Mar 27, 2009
Sold by
Flores Sylvia and Gomez Sylvia
Bought by
Flores Sylvia
Home Financials for this Owner
Home Financials are based on the most recent Mortgage that was taken out on this home.
Original Mortgage
$114,900
Interest Rate
5.04%
Mortgage Type
New Conventional
Purchase Details
Closed on
Feb 5, 2003
Sold by
Gomez Sylvia and Fernandez Erica
Bought by
Gomez Sylvia
Home Financials for this Owner
Home Financials are based on the most recent Mortgage that was taken out on this home.
Original Mortgage
$117,500
Interest Rate
5.76%
Purchase Details
Closed on
Mar 27, 1998
Sold by
Flores Victor M
Bought by
Gomez Sylvia
Home Financials for this Owner
Home Financials are based on the most recent Mortgage that was taken out on this home.
Original Mortgage
$120,200
Interest Rate
7%
Create a Home Valuation Report for This Property
The Home Valuation Report is an in-depth analysis detailing your home's value as well as a comparison with similar homes in the area
Home Values in the Area
Average Home Value in this Area
Purchase History
| Date | Buyer | Sale Price | Title Company |
|---|---|---|---|
| Sylvia Flores Trust | -- | None Listed On Document | |
| Flores Sylvia | -- | Chicago Title Company | |
| Gomez Sylvia | $59,000 | Cuesta Title Company | |
| Gomez Sylvia | -- | Cuesta Title | |
| Gomez Sylvia | $53,500 | Cuesta Title |
Source: Public Records
Mortgage History
| Date | Status | Borrower | Loan Amount |
|---|---|---|---|
| Previous Owner | Flores Sylvia | $114,900 | |
| Previous Owner | Gomez Sylvia | $117,500 | |
| Previous Owner | Gomez Sylvia | $120,200 |
Source: Public Records
Tax History Compared to Growth
Tax History
| Year | Tax Paid | Tax Assessment Tax Assessment Total Assessment is a certain percentage of the fair market value that is determined by local assessors to be the total taxable value of land and additions on the property. | Land | Improvement |
|---|---|---|---|---|
| 2025 | $1,856 | $179,458 | $85,409 | $94,049 |
| 2024 | $1,833 | $175,940 | $83,735 | $92,205 |
| 2023 | $1,833 | $172,492 | $82,094 | $90,398 |
| 2022 | $1,804 | $169,111 | $80,485 | $88,626 |
| 2021 | $1,798 | $165,796 | $78,907 | $86,889 |
| 2020 | $1,777 | $164,097 | $78,098 | $85,999 |
| 2019 | $1,764 | $160,880 | $76,567 | $84,313 |
| 2018 | $1,741 | $157,726 | $75,066 | $82,660 |
| 2017 | $1,707 | $154,635 | $73,595 | $81,040 |
| 2016 | $1,612 | $151,603 | $72,152 | $79,451 |
| 2015 | $1,588 | $149,327 | $71,069 | $78,258 |
| 2014 | $1,529 | $146,403 | $69,677 | $76,726 |
Source: Public Records
Map
Nearby Homes
- 232 Scarlett Cir
- Mesa Plan at Hill Street Terraces - Hill Street Series
- Pacific Plan at Hill Street Terraces - Hill Street Series
- Monarch Plan at Hill Street Terraces - Hill Street Series
- Rancho Plan at Hill Street Terraces - Hill Street Series
- Dana Plan at Hill Street Terraces - Hill Street Series
- 483 Violet Ave
- 680 Hill St
- 719 W Tefft St
- 522 Higos Way
- 626 Juno Ct
- 368 Avenida de Amigos
- 450 Avenida de Socios Unit 12
- 525 Grande Ave Unit D
- 759 Viola Ct
- 725 Monarch Ln
- 945 Jeanette Ln
- 840 Story St
- 457 Polaris Dr
- 261 Hazel Ln
- 780 Bristlecone Ln
- 759 Grande Ave
- 294 Ponderosa Place
- 298 Ponderosa Place
- 775 Bristlecone Ln
- 292 Ponderosa Place
- 320 Janice Way
- 288 Ponderosa Place
- 325 Janice Way
- 284 Ponderosa Place
- 764 Grande Ave
- 350 Janice Way
- 297 Ponderosa Place
- 299 Ponderosa Place
- 790 Bristlecone Ln
- 730 Cameron Ln
- 295 Ponderosa Place
- 280 Ponderosa Place
- 355 Janice Way
- 767 Grande Ave