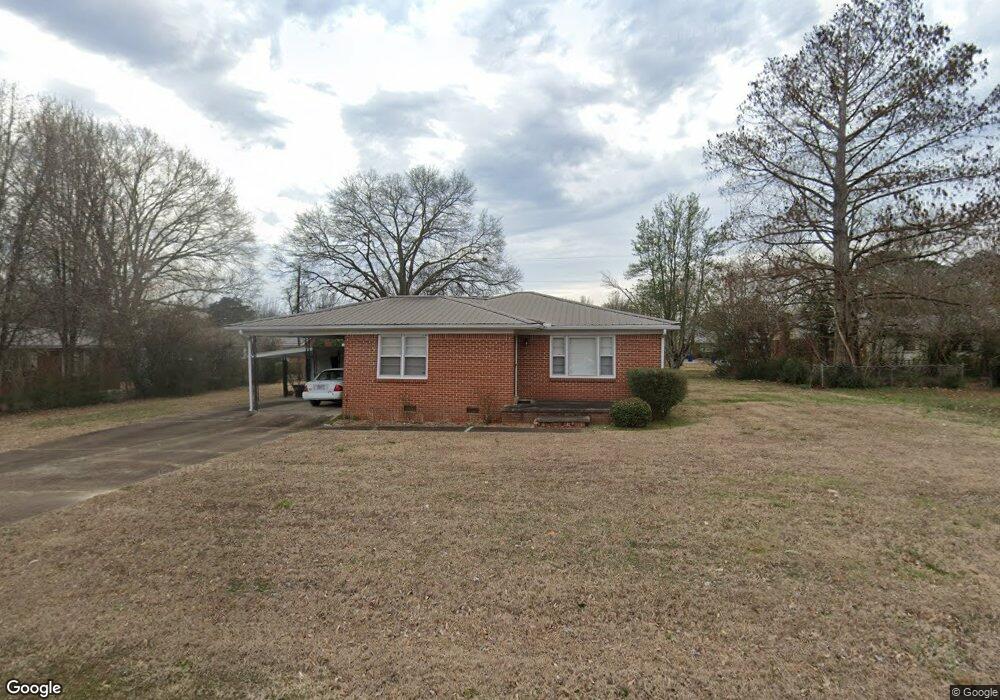
770 Main St E Savannah, TN 38372
Estimated Value: $107,000 - $134,000
Studio
1
Bath
1,250
Sq Ft
$98/Sq Ft
Est. Value
About This Home
This home is located at 770 Main St E, Savannah, TN 38372 and is currently estimated at $122,103, approximately $97 per square foot. 770 Main St E is a home located in Hardin County with nearby schools including Hardin County High School, Hardin County Christian School, and Savannah Christian Academy.
Ownership History
Date
Name
Owned For
Owner Type
Purchase Details
Closed on
Feb 18, 2014
Sold by
Killough Thomas Burns
Bought by
Cooper Leialohaleimaka
Current Estimated Value
Home Financials for this Owner
Home Financials are based on the most recent Mortgage that was taken out on this home.
Original Mortgage
$46,314
Interest Rate
4.43%
Mortgage Type
New Conventional
Purchase Details
Closed on
Jun 6, 1984
Bought by
Killough Ruby Margaret
Purchase Details
Closed on
Oct 19, 1955
Create a Home Valuation Report for This Property
The Home Valuation Report is an in-depth analysis detailing your home's value as well as a comparison with similar homes in the area
Home Values in the Area
Average Home Value in this Area
Purchase History
| Date | Buyer | Sale Price | Title Company |
|---|---|---|---|
| Cooper Leialohaleimaka | $36,000 | -- | |
| Killough Ruby Margaret | -- | -- | |
| -- | -- | -- |
Source: Public Records
Mortgage History
| Date | Status | Borrower | Loan Amount |
|---|---|---|---|
| Previous Owner | Cooper Leialohaleimaka | $46,314 |
Source: Public Records
Tax History
| Year | Tax Paid | Tax Assessment Tax Assessment Total Assessment is a certain percentage of the fair market value that is determined by local assessors to be the total taxable value of land and additions on the property. | Land | Improvement |
|---|---|---|---|---|
| 2025 | $742 | $30,300 | $2,250 | $28,050 |
| 2024 | $742 | $30,300 | $2,250 | $28,050 |
| 2023 | $742 | $30,300 | $2,250 | $28,050 |
| 2022 | $99 | $14,100 | $1,975 | $12,125 |
| 2021 | $389 | $14,100 | $1,975 | $12,125 |
| 2020 | $389 | $14,100 | $1,975 | $12,125 |
| 2019 | $389 | $14,100 | $1,975 | $12,125 |
| 2018 | $380 | $14,100 | $1,975 | $12,125 |
| 2017 | $338 | $12,150 | $1,975 | $10,175 |
| 2016 | $338 | $12,150 | $1,975 | $10,175 |
| 2015 | $306 | $12,150 | $1,975 | $10,175 |
| 2014 | $306 | $12,150 | $1,975 | $10,175 |
Source: Public Records
Map
Nearby Homes
Your Personal Tour Guide
Ask me questions while you tour the home.