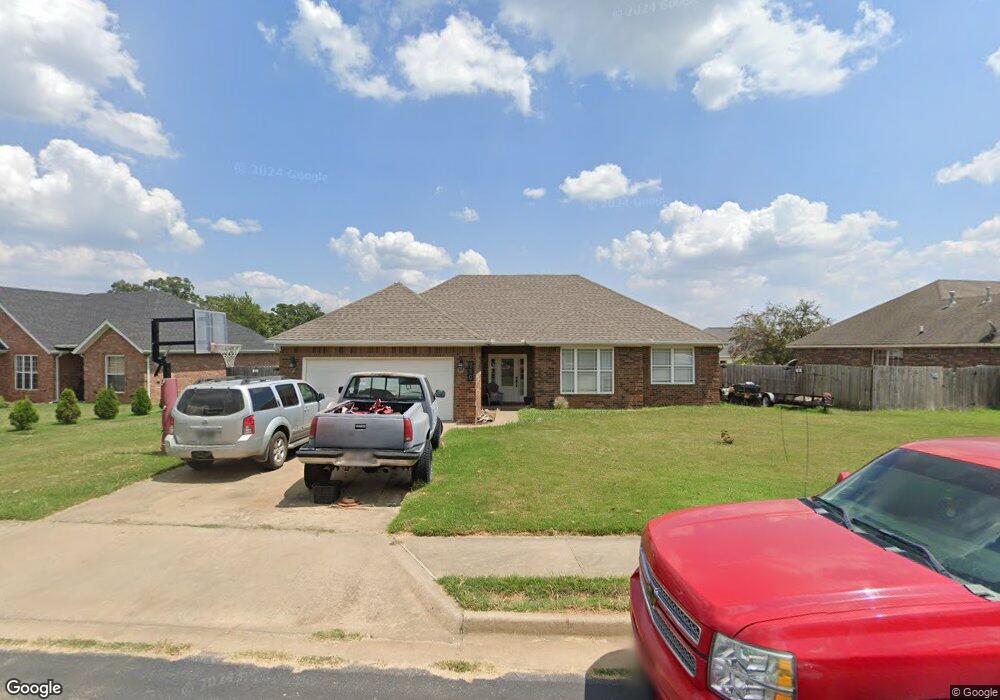
770 Napa Ave Centerton, AR 72719
Estimated Value: $304,639 - $317,000
3
Beds
2
Baths
1,605
Sq Ft
$194/Sq Ft
Est. Value
About This Home
This home is located at 770 Napa Ave, Centerton, AR 72719 and is currently estimated at $310,910, approximately $193 per square foot. 770 Napa Ave is a home located in Benton County with nearby schools including Centerton Gamble Elementary School, Grimsley Junior High School, and Creekside Middle School.
Ownership History
Date
Name
Owned For
Owner Type
Purchase Details
Closed on
Mar 1, 2005
Sold by
River Valley Homes Inc
Bought by
Wilmot Angela Dawn
Current Estimated Value
Home Financials for this Owner
Home Financials are based on the most recent Mortgage that was taken out on this home.
Original Mortgage
$140,781
Outstanding Balance
$70,890
Interest Rate
5.71%
Mortgage Type
New Conventional
Estimated Equity
$240,020
Purchase Details
Closed on
Dec 11, 2003
Bought by
H&G Prop
Purchase Details
Closed on
Dec 5, 2003
Bought by
River Vly Hms
Purchase Details
Closed on
Oct 21, 2003
Bought by
H and Prop
Create a Home Valuation Report for This Property
The Home Valuation Report is an in-depth analysis detailing your home's value as well as a comparison with similar homes in the area
Home Values in the Area
Average Home Value in this Area
Purchase History
| Date | Buyer | Sale Price | Title Company |
|---|---|---|---|
| Wilmot Angela Dawn | $140,000 | Waco Title Company | |
| H&G Prop | $1,802,000 | -- | |
| Riggins Land | $1,612,000 | -- | |
| River Vly Hms | $27,000 | -- | |
| H | $1,802,000 | -- | |
| Riggins Land | $1,612,000 | -- |
Source: Public Records
Mortgage History
| Date | Status | Borrower | Loan Amount |
|---|---|---|---|
| Open | Wilmot Angela Dawn | $140,781 |
Source: Public Records
Tax History
| Year | Tax Paid | Tax Assessment Tax Assessment Total Assessment is a certain percentage of the fair market value that is determined by local assessors to be the total taxable value of land and additions on the property. | Land | Improvement |
|---|---|---|---|---|
| 2025 | $2,181 | $55,181 | $15,000 | $40,181 |
| 2024 | $2,103 | $55,181 | $15,000 | $40,181 |
| 2023 | $2,003 | $36,260 | $7,600 | $28,660 |
| 2022 | $1,587 | $36,260 | $7,600 | $28,660 |
| 2021 | $1,483 | $36,260 | $7,600 | $28,660 |
| 2020 | $1,420 | $28,230 | $4,000 | $24,230 |
| 2019 | $1,420 | $28,230 | $4,000 | $24,230 |
| 2018 | $1,445 | $28,230 | $4,000 | $24,230 |
| 2017 | $1,251 | $28,230 | $4,000 | $24,230 |
| 2016 | $1,251 | $28,230 | $4,000 | $24,230 |
| 2015 | $1,532 | $24,830 | $4,000 | $20,830 |
| 2014 | $1,182 | $24,830 | $4,000 | $20,830 |
Source: Public Records
Map
Nearby Homes
- 1220 Shiraz Dr
- 1231 Gardenia St
- 677 Olivia Ln
- 703 Olivia Ln
- 820 Bob Glen Cir
- 1140 Rosemary St
- 1450 Dresden Dr
- 680 Reisling St
- 960 Silverthorn Dr
- 880 Bob Glen Cir
- 1590 Joseph Way
- 301 Spicewood Trail
- 1540 Edinburgh Dr
- 1531 Scotland Dr
- 1445 Bliss St
- 1540 Scotland Dr
- 1570 Scotland Dr
- 920 Queen St
- 540 Carlson St
- 1031 Evergreen St
Your Personal Tour Guide
Ask me questions while you tour the home.