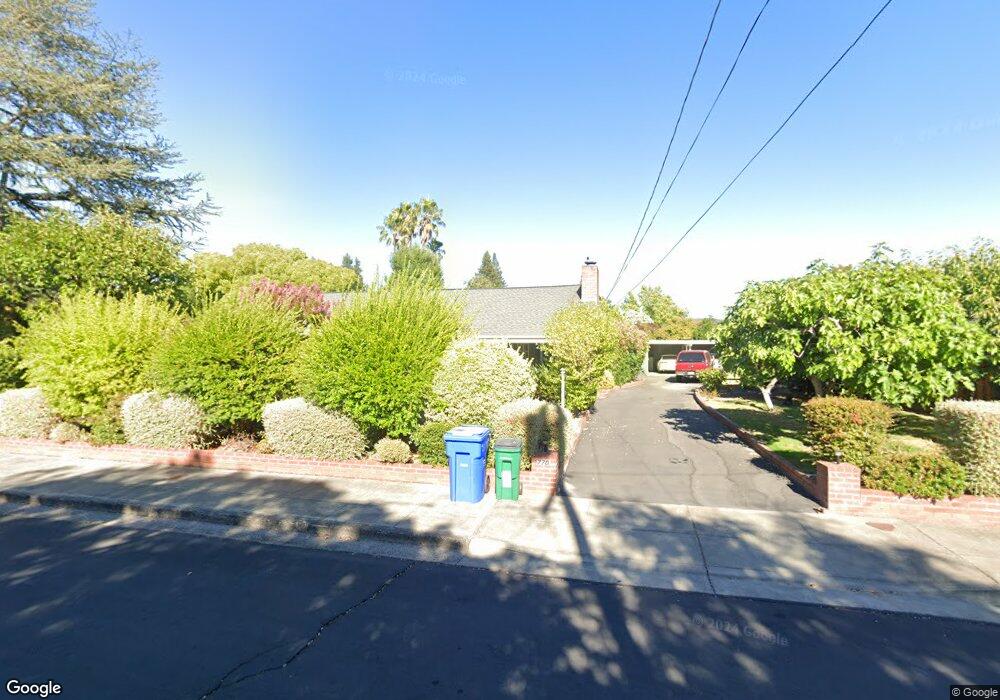
770 Oak Ln Sonoma, CA 95476
Estimated Value: $1,218,905 - $2,228,000
3
Beds
2
Baths
1,940
Sq Ft
$840/Sq Ft
Est. Value
About This Home
This home is located at 770 Oak Ln, Sonoma, CA 95476 and is currently estimated at $1,629,976, approximately $840 per square foot. 770 Oak Ln is a home located in Sonoma County with nearby schools including Prestwood Elementary School, Adele Harrison Middle School, and Creekside High School.
Ownership History
Date
Name
Owned For
Owner Type
Purchase Details
Closed on
Feb 16, 2021
Sold by
Sullivan Beverly Jean and Sullivan Daniel L
Bought by
Sullivan Daniel L
Current Estimated Value
Purchase Details
Closed on
Dec 22, 2016
Sold by
Sullivan Beverly Jean and The Db Trust
Bought by
Sullivan Beverly Jean and Sullivan Daniel L
Purchase Details
Closed on
Oct 3, 2003
Sold by
Sullivan Daniel L and Sullivan Beverly J
Bought by
Sullivan Daniel L and Sullivan Beverly Jean
Purchase Details
Closed on
May 13, 1998
Sold by
Sullivan Daniel L and Sullivan Beverly J
Bought by
Sullivan Daniel L and Sullivan Beverly J
Home Financials for this Owner
Home Financials are based on the most recent Mortgage that was taken out on this home.
Original Mortgage
$86,000
Outstanding Balance
$16,848
Interest Rate
7.13%
Estimated Equity
$1,613,128
Create a Home Valuation Report for This Property
The Home Valuation Report is an in-depth analysis detailing your home's value as well as a comparison with similar homes in the area
Home Values in the Area
Average Home Value in this Area
Purchase History
| Date | Buyer | Sale Price | Title Company |
|---|---|---|---|
| Sullivan Daniel L | -- | None Available | |
| Sullivan Beverly Jean | -- | None Available | |
| Sullivan Daniel L | -- | -- | |
| Sullivan Daniel L | -- | North American Title |
Source: Public Records
Mortgage History
| Date | Status | Borrower | Loan Amount |
|---|---|---|---|
| Open | Sullivan Daniel L | $86,000 |
Source: Public Records
Tax History
| Year | Tax Paid | Tax Assessment Tax Assessment Total Assessment is a certain percentage of the fair market value that is determined by local assessors to be the total taxable value of land and additions on the property. | Land | Improvement |
|---|---|---|---|---|
| 2025 | $2,623 | $119,137 | $37,008 | $82,129 |
| 2024 | $2,623 | $116,802 | $36,283 | $80,519 |
| 2023 | $2,623 | $114,513 | $35,572 | $78,941 |
| 2022 | $2,471 | $112,269 | $34,875 | $77,394 |
| 2021 | $2,316 | $110,069 | $34,192 | $75,877 |
| 2020 | $2,285 | $108,941 | $33,842 | $75,099 |
| 2019 | $2,230 | $106,806 | $33,179 | $73,627 |
| 2018 | $2,183 | $104,713 | $32,529 | $72,184 |
| 2017 | $2,390 | $102,661 | $31,892 | $70,769 |
| 2016 | $1,908 | $100,649 | $31,267 | $69,382 |
| 2015 | $1,908 | $99,138 | $30,798 | $68,340 |
| 2014 | $1,891 | $97,197 | $30,195 | $67,002 |
Source: Public Records
Map
Nearby Homes
Your Personal Tour Guide
Ask me questions while you tour the home.