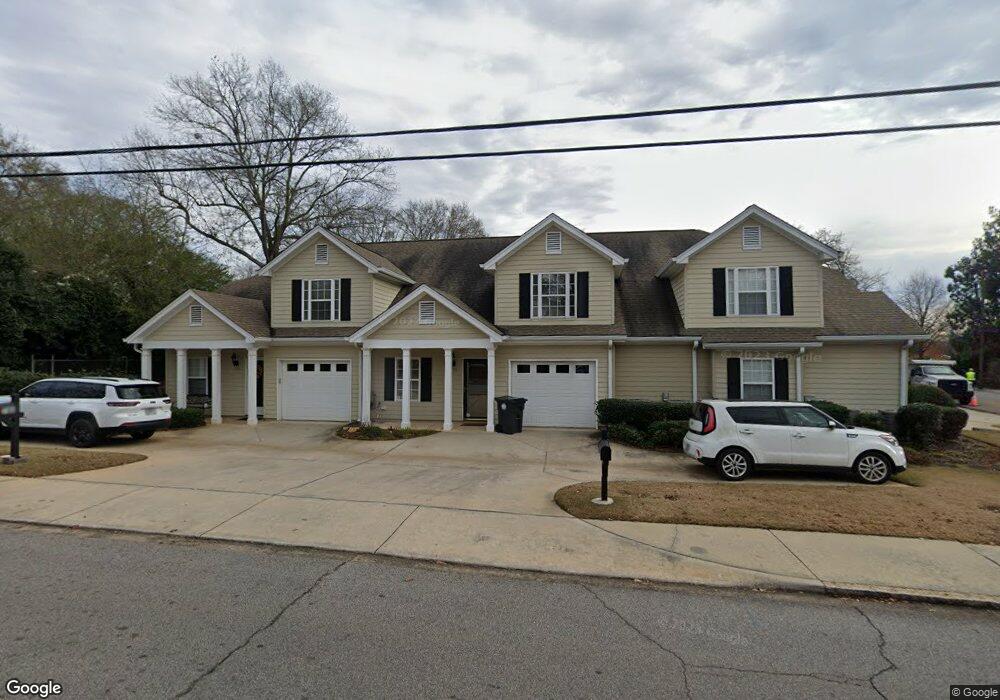
770 Park St Unit 3 Gainesville, GA 30501
Estimated Value: $335,000 - $338,319
3
Beds
3
Baths
1,786
Sq Ft
$189/Sq Ft
Est. Value
About This Home
This home is located at 770 Park St Unit 3, Gainesville, GA 30501 and is currently estimated at $337,080, approximately $188 per square foot. 770 Park St Unit 3 is a home located in Hall County with nearby schools including Enota Multiple Intelligences Academy, Gainesville Middle School, and Gainesville High School.
Ownership History
Date
Name
Owned For
Owner Type
Purchase Details
Closed on
Nov 6, 2025
Sold by
Lorenz Bradford A
Bought by
Harrison Benjamin and Harrison Sherri N
Current Estimated Value
Purchase Details
Closed on
May 31, 2024
Sold by
Woodall Reginald Scott
Bought by
Lorenz Bradford A
Home Financials for this Owner
Home Financials are based on the most recent Mortgage that was taken out on this home.
Original Mortgage
$259,200
Interest Rate
7.17%
Mortgage Type
New Conventional
Purchase Details
Closed on
Mar 26, 2020
Sold by
Dean Chanc Gordon
Bought by
Woodall Reginald Scott and Woodall Susan Kimbro
Purchase Details
Closed on
Apr 12, 2012
Sold by
Greenway Patricia G
Bought by
Greenway Patricia G
Purchase Details
Closed on
Jul 9, 2004
Sold by
Rogers Carlton W
Bought by
Greenway William and Greenway Patricia
Home Financials for this Owner
Home Financials are based on the most recent Mortgage that was taken out on this home.
Original Mortgage
$144,000
Interest Rate
6.25%
Mortgage Type
New Conventional
Create a Home Valuation Report for This Property
The Home Valuation Report is an in-depth analysis detailing your home's value as well as a comparison with similar homes in the area
Home Values in the Area
Average Home Value in this Area
Purchase History
| Date | Buyer | Sale Price | Title Company |
|---|---|---|---|
| Harrison Benjamin | $340,000 | -- | |
| Lorenz Bradford A | $324,000 | -- | |
| Woodall Reginald Scott | $190,000 | -- | |
| Greenway Patricia G | -- | -- | |
| Greenway William | $180,000 | -- |
Source: Public Records
Mortgage History
| Date | Status | Borrower | Loan Amount |
|---|---|---|---|
| Previous Owner | Lorenz Bradford A | $259,200 | |
| Previous Owner | Greenway William | $144,000 |
Source: Public Records
Tax History Compared to Growth
Tax History
| Year | Tax Paid | Tax Assessment Tax Assessment Total Assessment is a certain percentage of the fair market value that is determined by local assessors to be the total taxable value of land and additions on the property. | Land | Improvement |
|---|---|---|---|---|
| 2025 | $4,210 | $148,080 | $10,400 | $137,680 |
| 2024 | $3,032 | $105,880 | $8,000 | $97,880 |
| 2023 | $2,907 | $99,080 | $8,000 | $91,080 |
| 2022 | $420 | $89,120 | $8,000 | $81,120 |
| 2021 | $449 | $86,160 | $8,000 | $78,160 |
| 2020 | $1,017 | $111,480 | $36,720 | $74,760 |
| 2019 | $1,340 | $96,720 | $36,720 | $60,000 |
| 2018 | $472 | $81,541 | $36,720 | $44,821 |
| 2017 | $533 | $81,541 | $36,720 | $44,821 |
| 2016 | $1,062 | $81,541 | $36,720 | $44,821 |
| 2015 | $796 | $81,541 | $36,720 | $44,821 |
| 2014 | $796 | $81,541 | $36,720 | $44,821 |
Source: Public Records
Map
Nearby Homes
- 610 Candler St
- 549 Park Street Place
- 605 Candler St
- 605 Candler St Unit C9
- 1173 Saint Charles Place
- 1180 Springdale Rd
- 602 Dyer St
- 384 Forrest Ave
- 372 Forrest Ave
- 1304 Vine St NE
- 401 Ridgewood Ave
- 1436 Vine St NE
- 00 Jesse Jewell Pkwy
- 581 Bradford St NW
- 531 Crestview Terrace
- 306 Vinings Walk NW
- 601 Ridgewood Ave
- 311 Vinings Walk NW
- 511 Dixon Dr
- 943 Parkhill Place