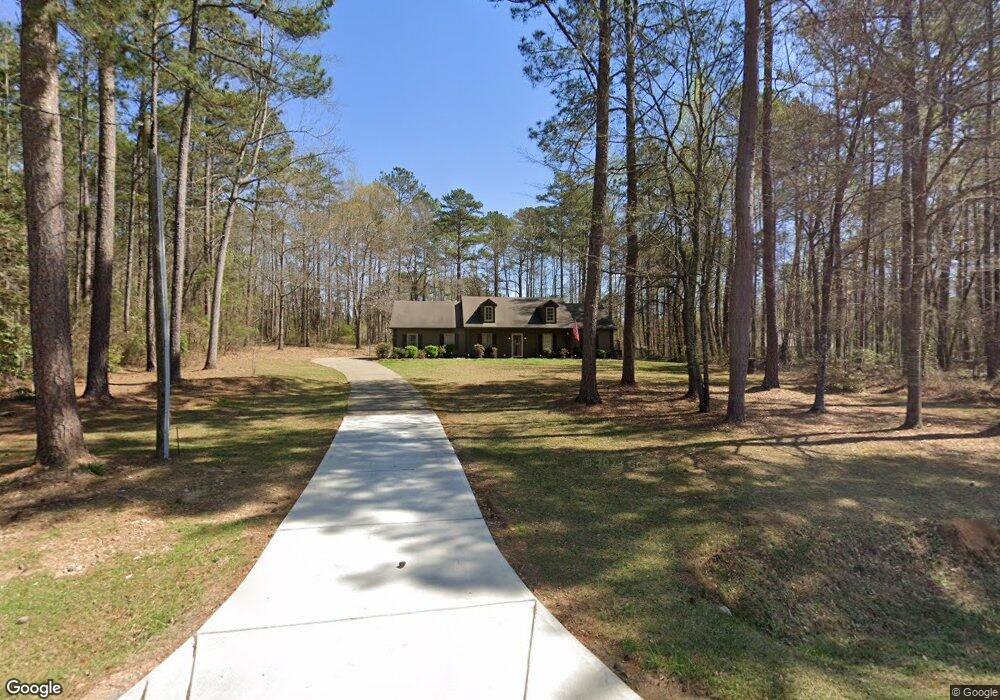
770 Waterview Dr Lagrange, GA 30240
Estimated Value: $244,847 - $264,000
3
Beds
2
Baths
1,727
Sq Ft
$148/Sq Ft
Est. Value
About This Home
This home is located at 770 Waterview Dr, Lagrange, GA 30240 and is currently estimated at $255,462, approximately $147 per square foot. 770 Waterview Dr is a home located in Troup County with nearby schools including Hillcrest Elementary School, Franklin Forest Elementary School, and Hollis Hand Elementary School.
Ownership History
Date
Name
Owned For
Owner Type
Purchase Details
Closed on
Jun 28, 2005
Sold by
Aspinwall James R
Bought by
Williford Teresa and Williford Kenneth
Current Estimated Value
Home Financials for this Owner
Home Financials are based on the most recent Mortgage that was taken out on this home.
Original Mortgage
$98,400
Outstanding Balance
$56,905
Interest Rate
7.69%
Mortgage Type
New Conventional
Estimated Equity
$198,557
Purchase Details
Closed on
May 6, 2003
Sold by
Timothy D Henry
Bought by
James R Aspinwall
Purchase Details
Closed on
Apr 29, 1997
Sold by
Lavaughn Thompson
Bought by
Timothy D Henry
Purchase Details
Closed on
Apr 16, 1997
Sold by
Timothy D Henry
Bought by
Lavaughn Thompson
Purchase Details
Closed on
Apr 8, 1997
Sold by
Lavaughn Thompson
Bought by
Timothy D Henry
Purchase Details
Closed on
Sep 6, 1996
Sold by
Rosser Chas
Bought by
Lavaughn Thompson
Purchase Details
Closed on
Aug 14, 1979
Bought by
Rosser Chas
Create a Home Valuation Report for This Property
The Home Valuation Report is an in-depth analysis detailing your home's value as well as a comparison with similar homes in the area
Purchase History
| Date | Buyer | Sale Price | Title Company |
|---|---|---|---|
| Williford Teresa | $123,000 | -- | |
| James R Aspinwall | $81,800 | -- | |
| Timothy D Henry | -- | -- | |
| Lavaughn Thompson | -- | -- | |
| Timothy D Henry | $83,500 | -- | |
| Lavaughn Thompson | $6,500 | -- | |
| Rosser Chas | $8,500 | -- |
Source: Public Records
Mortgage History
| Date | Status | Borrower | Loan Amount |
|---|---|---|---|
| Open | Williford Teresa | $98,400 |
Source: Public Records
Tax History
| Year | Tax Paid | Tax Assessment Tax Assessment Total Assessment is a certain percentage of the fair market value that is determined by local assessors to be the total taxable value of land and additions on the property. | Land | Improvement |
|---|---|---|---|---|
| 2025 | $2,197 | $80,560 | $10,000 | $70,560 |
| 2024 | $1,862 | $68,280 | $10,000 | $58,280 |
| 2023 | $1,875 | $68,760 | $10,000 | $58,760 |
| 2022 | $1,747 | $62,600 | $10,000 | $52,600 |
| 2021 | $1,416 | $46,960 | $4,880 | $42,080 |
| 2020 | $1,416 | $46,960 | $4,880 | $42,080 |
| 2019 | $1,193 | $39,560 | $4,880 | $34,680 |
| 2018 | $1,098 | $36,400 | $4,880 | $31,520 |
| 2017 | $1,098 | $36,400 | $4,880 | $31,520 |
| 2016 | $1,097 | $36,373 | $4,896 | $31,477 |
| 2015 | $1,099 | $36,373 | $4,896 | $31,477 |
| 2014 | $1,051 | $34,716 | $4,896 | $29,820 |
| 2013 | -- | $34,925 | $4,896 | $30,029 |
Source: Public Records
Map
Nearby Homes
- 0 Waterview Dr Unit 10558462
- 64 Waterview Ct
- 219 E Yorktown Dr
- 24 N Brooks Rd
- 178 Waterview Dr
- 111 Copper Creek Dr
- 120 Copper Creek Dr
- 113 Wellington Dr
- 206 Sturbridge Dr
- 135 Copper Creek Dr
- 130 Sunny Point Cir
- 114 Taylor Len Dr
- 110 Pond View Point
- 109 Windridge
- 107 Windridge
- 103 Woodchase
- 207 N View Pointe Dr
- 103 Windridge
- 209 River Oaks Dr
- 205 River Oaks Dr
- 675 Waterview Dr
- 782 Waterview Dr
- 693 Waterview Dr
- 804 Waterview Dr
- 775 Waterview Dr
- LOT 52 Waterview Dr
- lot 8 Waterview Dr
- lot 8 Waterview Dr Unit lot 8
- Lot 79 Waterview Dr
- 785 Waterview Dr
- 695 Waterview Dr
- 767 Waterview Dr
- 773 Waterview Dr
- 552 Waterview Dr
- 0 Waterview Lot 34 Dr Unit 10500921
- 715 Waterview Dr
- 0 Waterview Lots 37 & 27b Dr Unit 7556282
- 691 Waterview Dr
- 660 Waterview Dr
- 621 Waterview Dr
Your Personal Tour Guide
Ask me questions while you tour the home.