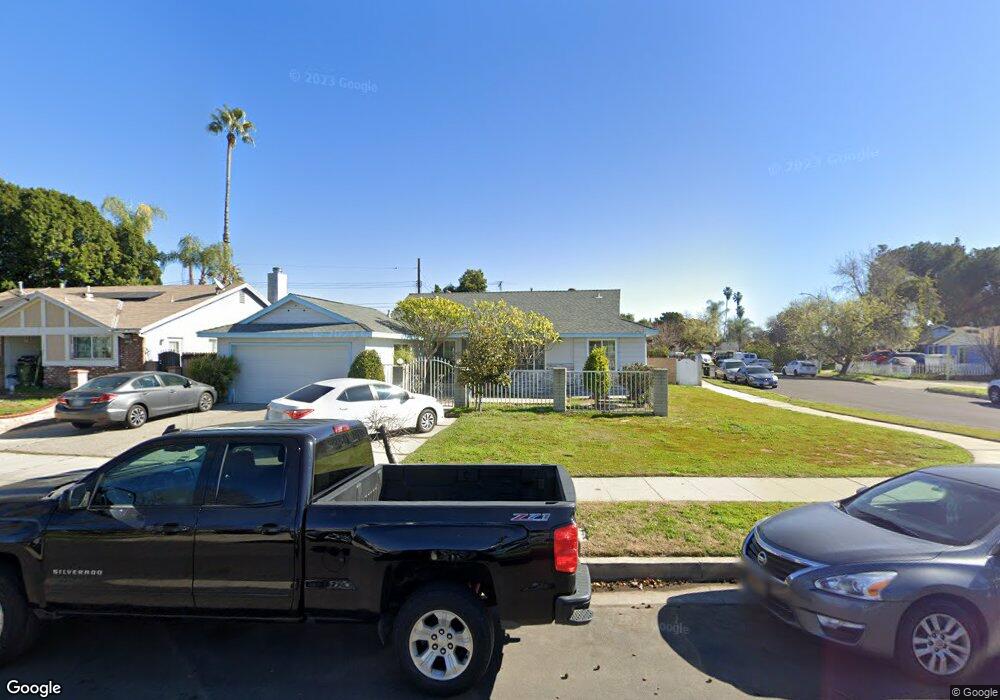
7700 Eton Ave Canoga Park, CA 91304
Canoga Park NeighborhoodEstimated Value: $761,000 - $851,000
3
Beds
2
Baths
1,742
Sq Ft
$468/Sq Ft
Est. Value
About This Home
This home is located at 7700 Eton Ave, Canoga Park, CA 91304 and is currently estimated at $816,051, approximately $468 per square foot. 7700 Eton Ave is a home located in Los Angeles County with nearby schools including Canoga Park Elementary School, Christopher Columbus Middle School, and Canoga Park Senior High School.
Ownership History
Date
Name
Owned For
Owner Type
Purchase Details
Closed on
Jun 29, 2019
Sold by
Tran Nam and Bui Vinh Thi
Bought by
Tran Nam V and Bui Vinh T
Current Estimated Value
Purchase Details
Closed on
Apr 21, 1998
Sold by
Federal Home Loan Mortgage Corporation
Bought by
Tran Nam and Bui Vinh Thi
Home Financials for this Owner
Home Financials are based on the most recent Mortgage that was taken out on this home.
Original Mortgage
$123,600
Outstanding Balance
$23,566
Interest Rate
7.15%
Estimated Equity
$792,485
Purchase Details
Closed on
Nov 17, 1997
Sold by
Pham Hoan N and Federal Home Loan Mortgage Cor
Bought by
Federal Home Loan Mortgage Corporation
Purchase Details
Closed on
Jul 6, 1993
Sold by
Jenkins Donna J and Martinez Donna J
Bought by
Pham Hoan N and Pham Dien T
Home Financials for this Owner
Home Financials are based on the most recent Mortgage that was taken out on this home.
Original Mortgage
$146,700
Interest Rate
7.16%
Create a Home Valuation Report for This Property
The Home Valuation Report is an in-depth analysis detailing your home's value as well as a comparison with similar homes in the area
Home Values in the Area
Average Home Value in this Area
Purchase History
| Date | Buyer | Sale Price | Title Company |
|---|---|---|---|
| Tran Nam V | -- | None Available | |
| Tran Nam | $145,500 | First American Title Co | |
| Federal Home Loan Mortgage Corporation | $142,000 | Lawyers Title Company | |
| Pham Hoan N | $163,000 | -- | |
| Jenkins Donna J | -- | -- |
Source: Public Records
Mortgage History
| Date | Status | Borrower | Loan Amount |
|---|---|---|---|
| Open | Tran Nam | $123,600 | |
| Previous Owner | Pham Hoan N | $146,700 |
Source: Public Records
Tax History Compared to Growth
Tax History
| Year | Tax Paid | Tax Assessment Tax Assessment Total Assessment is a certain percentage of the fair market value that is determined by local assessors to be the total taxable value of land and additions on the property. | Land | Improvement |
|---|---|---|---|---|
| 2025 | $3,052 | $232,295 | $127,722 | $104,573 |
| 2024 | $3,052 | $227,741 | $125,218 | $102,523 |
| 2023 | $2,997 | $223,276 | $122,763 | $100,513 |
| 2022 | $2,867 | $218,899 | $120,356 | $98,543 |
| 2021 | $2,824 | $214,608 | $117,997 | $96,611 |
| 2019 | $2,744 | $208,246 | $114,499 | $93,747 |
| 2018 | $2,645 | $204,163 | $112,254 | $91,909 |
| 2017 | $2,588 | $200,160 | $110,053 | $90,107 |
| 2016 | $2,513 | $196,237 | $107,896 | $88,341 |
| 2015 | $2,478 | $193,291 | $106,276 | $87,015 |
| 2014 | $2,494 | $189,506 | $104,195 | $85,311 |
Source: Public Records
Map
Nearby Homes
- 7741 Variel Ave
- 21018 Lull St
- 7716 Owensmouth Ave
- 7502 Remmet Ave
- 7506 Independence Ave
- 7356 Eton Ave
- 7725 Owensmouth Ave
- 7447 Loma Verde Ave
- 7519 Owensmouth Ave
- 7605 Jordan Ave Unit 6
- 7551 Jordan Ave Unit 405
- 7551 Jordan Ave Unit 109
- 21032 Baltar St
- 20854 Runnymede St
- 7327 Loma Verde Ave
- 7801 Kelvin Ave
- 7435 Jordan Ave
- 7650 Topanga Canyon Blvd Unit 14
- 7800 Topanga Canyon Blvd Unit 208
- 20828 Blythe St