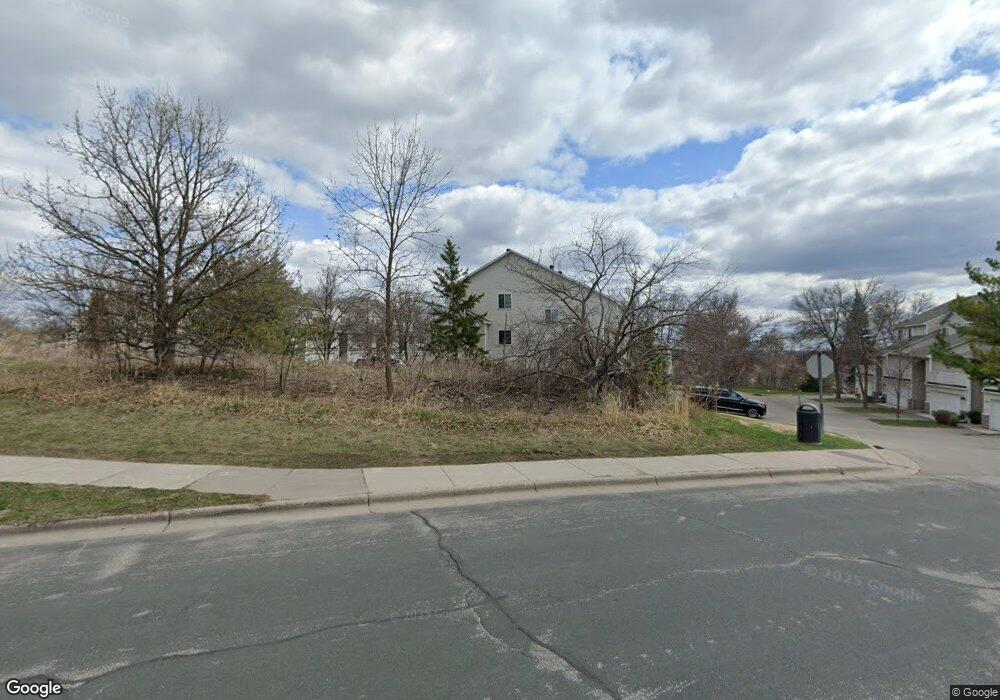
7703 Nicholas Way Chanhassen, MN 55317
Estimated Value: $271,000 - $278,000
2
Beds
2
Baths
1,079
Sq Ft
$254/Sq Ft
Est. Value
About This Home
This home is located at 7703 Nicholas Way, Chanhassen, MN 55317 and is currently estimated at $273,763, approximately $253 per square foot. 7703 Nicholas Way is a home located in Carver County with nearby schools including Chanhassen Elementary School, Pioneer Ridge Middle School, and Chanhassen High School.
Ownership History
Date
Name
Owned For
Owner Type
Purchase Details
Closed on
Oct 8, 2021
Sold by
Carroll Brian P and Carroll Cynthia M
Bought by
Le Tracy
Current Estimated Value
Home Financials for this Owner
Home Financials are based on the most recent Mortgage that was taken out on this home.
Original Mortgage
$212,800
Outstanding Balance
$194,054
Interest Rate
2.8%
Mortgage Type
New Conventional
Estimated Equity
$79,709
Purchase Details
Closed on
May 2, 2016
Sold by
Carroll Brian P and Carroll Cynthia M
Bought by
The Carroll Living Trust
Purchase Details
Closed on
Feb 14, 2011
Sold by
Pfanstiel Douglas
Bought by
Carroll Brian P and Carroll Cnthia M
Purchase Details
Closed on
Apr 24, 1998
Sold by
Degraffenreid Allison L
Bought by
Pfanstiel Douglas
Purchase Details
Closed on
Oct 18, 1996
Sold by
Mcvicar Elisabeth Marianne
Bought by
Degraffenreid Allison L
Create a Home Valuation Report for This Property
The Home Valuation Report is an in-depth analysis detailing your home's value as well as a comparison with similar homes in the area
Home Values in the Area
Average Home Value in this Area
Purchase History
| Date | Buyer | Sale Price | Title Company |
|---|---|---|---|
| Le Tracy | $224,000 | Trademark Title Services Inc | |
| The Carroll Living Trust | -- | Attorney | |
| Carroll Brian P | $10,000 | -- | |
| Pfanstiel Douglas | $90,000 | -- | |
| Degraffenreid Allison L | $98,000 | -- |
Source: Public Records
Mortgage History
| Date | Status | Borrower | Loan Amount |
|---|---|---|---|
| Open | Le Tracy | $212,800 |
Source: Public Records
Tax History Compared to Growth
Tax History
| Year | Tax Paid | Tax Assessment Tax Assessment Total Assessment is a certain percentage of the fair market value that is determined by local assessors to be the total taxable value of land and additions on the property. | Land | Improvement |
|---|---|---|---|---|
| 2025 | $2,508 | $264,400 | $80,000 | $184,400 |
| 2024 | $2,546 | $259,400 | $70,000 | $189,400 |
| 2023 | $2,422 | $257,500 | $70,000 | $187,500 |
| 2022 | $2,320 | $247,900 | $66,000 | $181,900 |
| 2021 | $2,124 | $201,100 | $56,200 | $144,900 |
| 2020 | $2,062 | $191,700 | $56,200 | $135,500 |
| 2019 | $2,056 | $181,600 | $53,500 | $128,100 |
| 2018 | $1,912 | $181,600 | $53,500 | $128,100 |
| 2017 | $1,828 | $166,500 | $48,700 | $117,800 |
| 2016 | $1,714 | $117,400 | $0 | $0 |
| 2015 | $1,692 | $122,900 | $0 | $0 |
| 2014 | $1,692 | $108,300 | $0 | $0 |
Source: Public Records
Map
Nearby Homes
- 7719 Nicholas Way
- 7639 Nicholas Way
- 720 W Village Rd Unit 106
- 710 W Village Rd Unit 105
- 5523 Game Farm Lookout
- 7611 Iroquois St
- 7406 Laredo Dr
- 760 Bighorn Dr
- 7104 Pontiac Cir
- 7291 Pontiac Cir
- 1003 Pontiac Ln
- 1321 Lake Dr W Unit 216
- 7602 Erie Ave
- 1042 Pontiac Ln
- 7006 Chaparral Ln
- 8410 Burlwood Dr
- 601 Fox Hill Dr
- 7490 Chanhassen Rd
- 834 Cree Dr
- 537 Mission Hills Dr
- 7705 Nicholas Way
- 7701 Nicholas Way
- 7711 Nicholas Way
- 7707 Nicholas Way
- 7713 Nicholas Way
- 7709 Nicholas Way
- 7715 Nicholas Way
- 7693 Nicholas Way
- 7695 Nicholas Way
- 7697 Nicholas Way
- 7699 Nicholas Way
- 7721 Nicholas Way
- 7685 Nicholas Way
- 7687 Nicholas Way
- 7717 Nicholas Way
- 7723 Nicholas Way
- 7689 Nicholas Way
- 7691 Nicholas Way
- 913 Santa Vera Dr
- 915 Santa Vera Dr