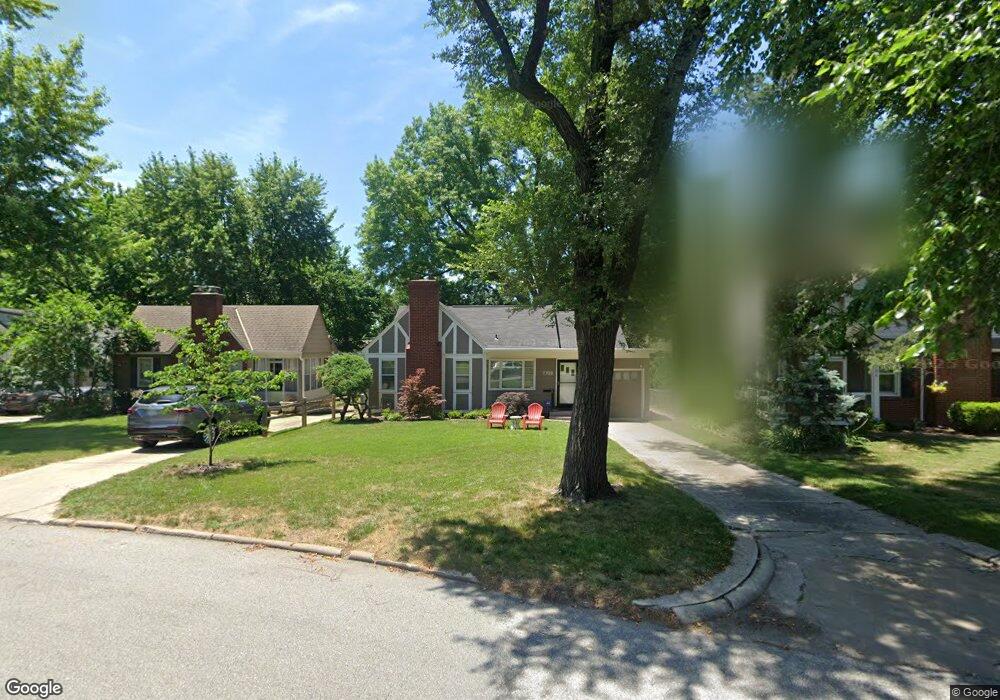
7708 Jarboe St Kansas City, MO 64114
Waldo NeighborhoodEstimated Value: $258,000 - $301,374
2
Beds
1
Bath
1,152
Sq Ft
$247/Sq Ft
Est. Value
About This Home
This home is located at 7708 Jarboe St, Kansas City, MO 64114 and is currently estimated at $284,094, approximately $246 per square foot. 7708 Jarboe St is a home located in Jackson County with nearby schools including Hale Cook Elementary, Central Middle School, and Southeast High School.
Ownership History
Date
Name
Owned For
Owner Type
Purchase Details
Closed on
May 24, 2002
Sold by
Callahan Kathi
Bought by
Clark Robert F
Current Estimated Value
Home Financials for this Owner
Home Financials are based on the most recent Mortgage that was taken out on this home.
Original Mortgage
$125,037
Outstanding Balance
$52,761
Interest Rate
6.92%
Mortgage Type
Purchase Money Mortgage
Estimated Equity
$231,333
Purchase Details
Closed on
Sep 20, 1999
Bought by
Callahan Kathi
Home Financials for this Owner
Home Financials are based on the most recent Mortgage that was taken out on this home.
Original Mortgage
$105,837
Interest Rate
7.9%
Mortgage Type
FHA
Purchase Details
Closed on
May 30, 1996
Sold by
Meyers Lucille R and Meyers Lucille Everett
Bought by
Anderton Kerri L
Home Financials for this Owner
Home Financials are based on the most recent Mortgage that was taken out on this home.
Original Mortgage
$77,123
Interest Rate
7.93%
Mortgage Type
FHA
Create a Home Valuation Report for This Property
The Home Valuation Report is an in-depth analysis detailing your home's value as well as a comparison with similar homes in the area
Home Values in the Area
Average Home Value in this Area
Purchase History
| Date | Buyer | Sale Price | Title Company |
|---|---|---|---|
| Clark Robert F | -- | -- | |
| Callahan Kathi | -- | -- | |
| Anderton Kerri L | $78,000 | Ati Title Company |
Source: Public Records
Mortgage History
| Date | Status | Borrower | Loan Amount |
|---|---|---|---|
| Open | Clark Robert F | $125,037 | |
| Previous Owner | Callahan Kathi | $105,837 | |
| Previous Owner | Anderton Kerri L | $77,123 |
Source: Public Records
Tax History Compared to Growth
Tax History
| Year | Tax Paid | Tax Assessment Tax Assessment Total Assessment is a certain percentage of the fair market value that is determined by local assessors to be the total taxable value of land and additions on the property. | Land | Improvement |
|---|---|---|---|---|
| 2025 | $3,416 | $42,214 | $15,238 | $26,976 |
| 2024 | $3,383 | $43,276 | $6,749 | $36,527 |
| 2023 | $3,383 | $43,277 | $6,806 | $36,471 |
| 2022 | $2,626 | $31,920 | $6,964 | $24,956 |
| 2021 | $2,617 | $31,920 | $6,964 | $24,956 |
| 2020 | $2,329 | $28,055 | $6,964 | $21,091 |
| 2019 | $2,281 | $28,055 | $6,964 | $21,091 |
| 2018 | $2,121 | $26,648 | $4,417 | $22,231 |
| 2017 | $2,121 | $26,648 | $4,417 | $22,231 |
| 2016 | $2,080 | $25,980 | $5,637 | $20,343 |
| 2014 | $2,045 | $25,471 | $5,527 | $19,944 |
Source: Public Records
Map
Nearby Homes
- 7826 Summit St
- 1127 W 76th Terrace
- 7615 Terrace St
- 8020 Mercier St
- 7544 Summit St
- 514 W 77th St
- 208 W 81st St
- 8110 Ward Parkway Plaza
- 2207 W 79th Terrace
- 7602 Pennsylvania Ave
- 8117 Summit St
- 826 W 75th St
- 7515 Jefferson St
- 7416 Belleview Ave
- 7514 Pennsylvania Ave
- 2318 W 79th St
- 8232 Jarboe St
- 2400 W 77th St
- 2019 W 81st Terrace
- 8304 Mercier St
- 7710 Jarboe St
- 7706 Jarboe St
- 7712 Jarboe St
- 7704 Jarboe St
- 7714 Jarboe St
- 7715 Jarboe St
- 7800 Jarboe St
- 7721 Ward Parkway Plaza
- 7702 Jarboe St
- 7719 Ward Parkway Plaza
- 1008 W 78th St
- 7723 Ward Parkway Plaza
- 7711 Jarboe St
- 7717 Ward Parkway Plaza
- 7725 Ward Parkway Plaza
- 7715 Ward Pkwy
- 7802 Jarboe St
- 7715 Ward Parkway Plaza
- 7727 Ward Parkway Plaza
- 7707 Jarboe St