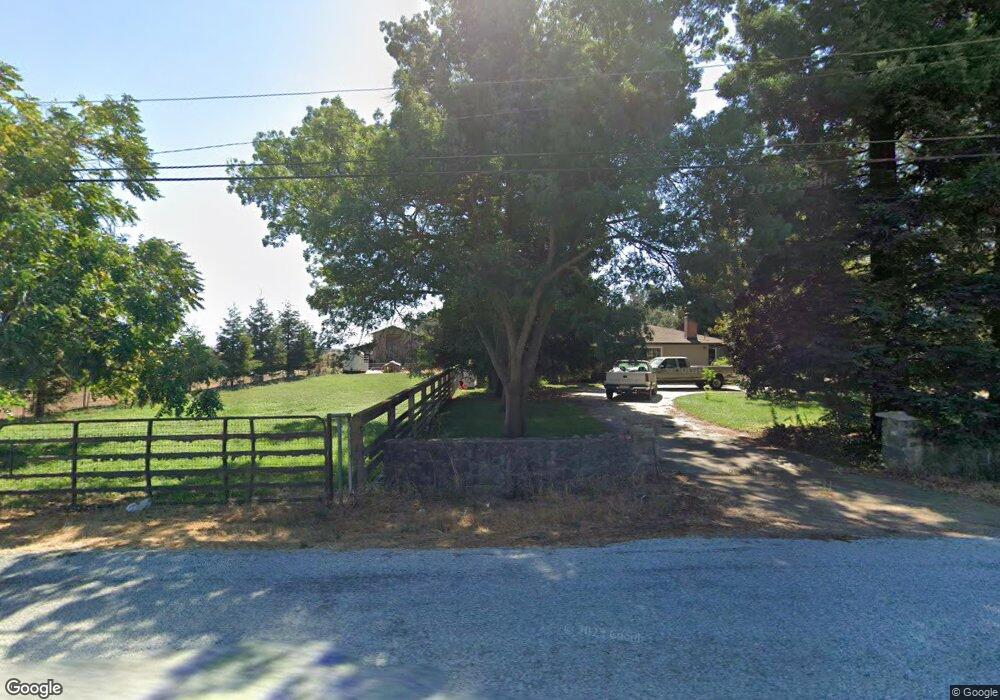
770A Buena Vista Ave Gilroy, CA 95020
Estimated Value: $1,278,537 - $1,531,000
4
Beds
2
Baths
1,745
Sq Ft
$794/Sq Ft
Est. Value
About This Home
This home is located at 770A Buena Vista Ave, Gilroy, CA 95020 and is currently estimated at $1,386,384, approximately $794 per square foot. 770A Buena Vista Ave is a home located in Santa Clara County with nearby schools including Rucker Elementary School, Solorsano Middle School, and Christopher High School.
Ownership History
Date
Name
Owned For
Owner Type
Purchase Details
Closed on
Sep 2, 2020
Sold by
Bettencourt Heidi M and Bettencourt Keith Christian
Bought by
Bettencourt Heidi M and Bettencourt Keith Christian
Current Estimated Value
Home Financials for this Owner
Home Financials are based on the most recent Mortgage that was taken out on this home.
Original Mortgage
$605,000
Outstanding Balance
$536,897
Interest Rate
2.9%
Mortgage Type
New Conventional
Estimated Equity
$849,487
Purchase Details
Closed on
Feb 25, 2015
Sold by
Stockdale Barbara Jean
Bought by
Bettencourt Heidi M and Bettencourt Keith Christian
Home Financials for this Owner
Home Financials are based on the most recent Mortgage that was taken out on this home.
Original Mortgage
$636,446
Interest Rate
3.77%
Mortgage Type
FHA
Purchase Details
Closed on
Jan 18, 2007
Sold by
Stockdale Barbara Jean
Bought by
Stockdale Barbara Jean
Create a Home Valuation Report for This Property
The Home Valuation Report is an in-depth analysis detailing your home's value as well as a comparison with similar homes in the area
Home Values in the Area
Average Home Value in this Area
Purchase History
| Date | Buyer | Sale Price | Title Company |
|---|---|---|---|
| Bettencourt Heidi M | -- | Old Republic Title | |
| Bettencourt Heidi M | $720,000 | Chicago Title Company | |
| Stockdale Barbara Jean | -- | None Available |
Source: Public Records
Mortgage History
| Date | Status | Borrower | Loan Amount |
|---|---|---|---|
| Open | Bettencourt Heidi M | $605,000 | |
| Previous Owner | Bettencourt Heidi M | $636,446 |
Source: Public Records
Tax History Compared to Growth
Tax History
| Year | Tax Paid | Tax Assessment Tax Assessment Total Assessment is a certain percentage of the fair market value that is determined by local assessors to be the total taxable value of land and additions on the property. | Land | Improvement |
|---|---|---|---|---|
| 2025 | $10,447 | $865,323 | $519,196 | $346,127 |
| 2024 | $10,447 | $848,357 | $509,016 | $339,341 |
| 2023 | $10,372 | $831,724 | $499,036 | $332,688 |
| 2022 | $10,187 | $815,416 | $489,251 | $326,165 |
| 2021 | $10,142 | $799,428 | $479,658 | $319,770 |
| 2020 | $10,019 | $791,232 | $474,740 | $316,492 |
| 2019 | $9,921 | $775,719 | $465,432 | $310,287 |
| 2018 | $9,219 | $760,509 | $456,306 | $304,203 |
| 2017 | $9,414 | $745,598 | $447,359 | $298,239 |
| 2016 | $9,276 | $730,980 | $438,588 | $292,392 |
| 2015 | $2,231 | $182,930 | $37,272 | $145,658 |
| 2014 | -- | $179,347 | $36,542 | $142,805 |
Source: Public Records
Map
Nearby Homes
- 0002 Buena Vista Ave
- 0 Buena Vista Ave
- 700 Las Animas Ave
- 2055 Rucker Ave
- 10055 Foothill Ave
- 119 Farrell Ave
- 103 Farrell Ave
- 111 Farrell Ave
- 264 Windsong Way
- 9135 Desiderio Way
- 145 Masten Ave
- 201 Ronan Ave
- 190 Ronan Ave
- 100 Block Ronan Ave
- 232 Loupe Ct
- 310 Lena Ave
- 9900 Walter Welsher Ct
- 670 Wickham Ct
- 1 Poli Rd
- 0 Apn 835-07-018 and Apn 835-07-019 Ave Unit ML82018888
- 770 Buena Vista Ave
- 750 Lepa Ct
- 820 Buena Vista Ave
- 720 Lepa Ct
- 0001 Buena Vista Ave
- 740 Lepa Ct
- 700 Buena Vista Ave
- 9840 N Name Uno
- 730 Lepa Ct
- 650 Buena Vista Ave
- 725 Buena Vista Ave
- 9999 No Name
- 675 Buena Vista Ave
- 9790 No Name Uno Rd
- 9790 N Name Uno
- 9850 N Name Uno
- 670 Denio Ave
- 595 Buena Vista Ave
- 900 Buena Vista Ave
- 660 Denio Ave