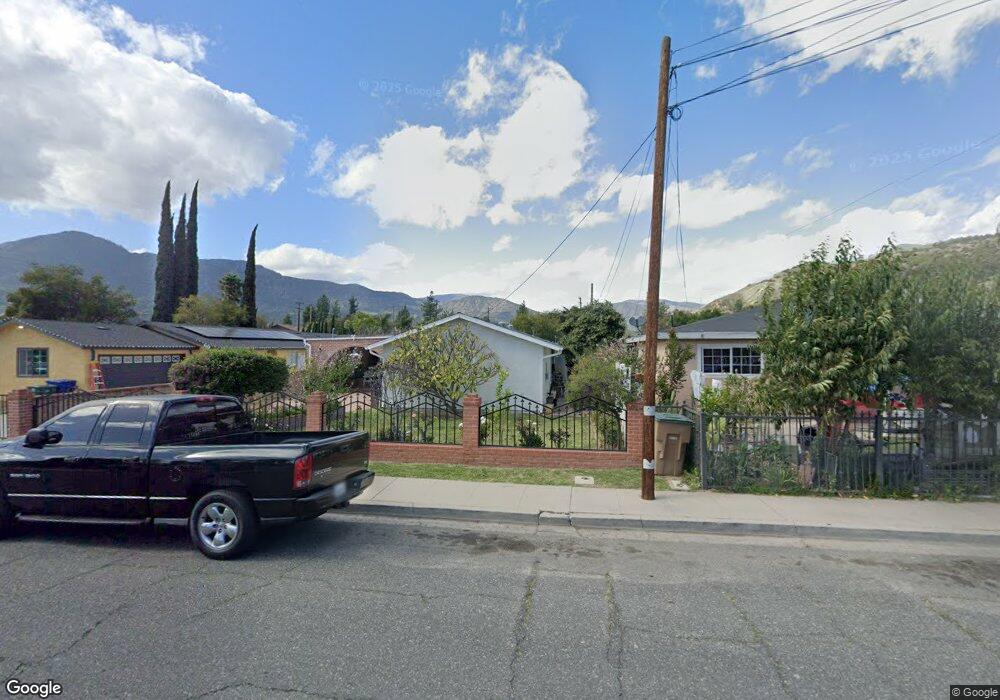
771 4th St Fillmore, CA 93015
Estimated Value: $561,000 - $754,000
3
Beds
2
Baths
1,152
Sq Ft
$562/Sq Ft
Est. Value
About This Home
This home is located at 771 4th St, Fillmore, CA 93015 and is currently estimated at $647,339, approximately $561 per square foot. 771 4th St is a home located in Ventura County with nearby schools including Fillmore Senior High.
Ownership History
Date
Name
Owned For
Owner Type
Purchase Details
Closed on
Apr 25, 2018
Sold by
Negrete Jose C and Negrete Elena
Bought by
Negrete Patricia
Current Estimated Value
Purchase Details
Closed on
Dec 29, 2017
Sold by
Negrete Patricia and Negrete Jose C
Bought by
Negrete Jose C and Negrete Elena
Purchase Details
Closed on
Aug 7, 2014
Sold by
Negrete Jose C and Negrete Maria Elena
Bought by
Negrete Patricia
Purchase Details
Closed on
Sep 13, 2001
Sold by
Negrete Jose C and Negrete Maria Elena
Bought by
Negrete Jose C and Negrete Maria Elena
Home Financials for this Owner
Home Financials are based on the most recent Mortgage that was taken out on this home.
Original Mortgage
$130,000
Interest Rate
6.9%
Create a Home Valuation Report for This Property
The Home Valuation Report is an in-depth analysis detailing your home's value as well as a comparison with similar homes in the area
Home Values in the Area
Average Home Value in this Area
Purchase History
| Date | Buyer | Sale Price | Title Company |
|---|---|---|---|
| Negrete Patricia | -- | None Available | |
| Negrete Jose C | -- | None Available | |
| Negrete Patricia | -- | None Available | |
| Negrete Jose C | -- | Old Republic Title Company |
Source: Public Records
Mortgage History
| Date | Status | Borrower | Loan Amount |
|---|---|---|---|
| Closed | Negrete Jose C | $130,000 |
Source: Public Records
Tax History Compared to Growth
Tax History
| Year | Tax Paid | Tax Assessment Tax Assessment Total Assessment is a certain percentage of the fair market value that is determined by local assessors to be the total taxable value of land and additions on the property. | Land | Improvement |
|---|---|---|---|---|
| 2025 | $1,634 | $143,632 | $69,639 | $73,993 |
| 2024 | $1,634 | $140,816 | $68,273 | $72,543 |
| 2023 | $1,612 | $138,055 | $66,934 | $71,121 |
| 2022 | $1,493 | $135,349 | $65,622 | $69,727 |
| 2021 | $1,693 | $132,696 | $64,336 | $68,360 |
| 2020 | $1,574 | $131,337 | $63,677 | $67,660 |
| 2019 | $4,868 | $408,000 | $265,200 | $142,800 |
| 2018 | $3,418 | $285,189 | $185,373 | $99,816 |
| 2017 | $3,438 | $279,598 | $181,739 | $97,859 |
| 2016 | $3,183 | $274,117 | $178,176 | $95,941 |
| 2015 | $3,096 | $270,000 | $175,500 | $94,500 |
| 2014 | $1,324 | $117,166 | $56,808 | $60,358 |
Source: Public Records
Map
Nearby Homes
- 770 Edison Ln
- 621 Lemon Way
- 939 Meadowlark Dr
- 412 Blaine Ave
- 1041 Meadowlark Dr
- 1028 Meadowlark Dr
- 1032 Meadowlark Dr
- 803 Sespe Ave
- 1062 Meadowlark Dr
- 600 C St
- 638 Clay St
- 0 Fillmore St
- 340 Central Ave
- 1407 Goodenough Rd
- 300 C St
- 232 Village Square
- 1526 Grand Ave
- 320 D St
- 229 Main St
- 660 River St Unit D