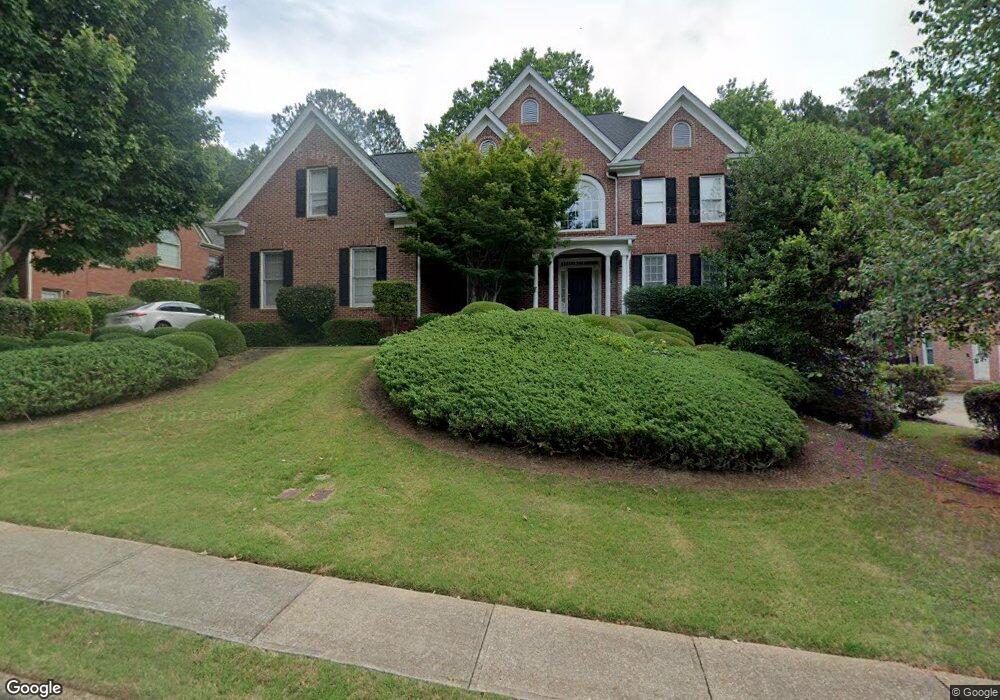
771 Bentgrass Ct Dacula, GA 30019
Estimated Value: $654,636 - $758,000
5
Beds
5
Baths
3,767
Sq Ft
$185/Sq Ft
Est. Value
About This Home
This home is located at 771 Bentgrass Ct, Dacula, GA 30019 and is currently estimated at $695,659, approximately $184 per square foot. 771 Bentgrass Ct is a home located in Gwinnett County with nearby schools including Dacula Elementary School, Dacula Middle School, and Dacula High School.
Ownership History
Date
Name
Owned For
Owner Type
Purchase Details
Closed on
Jun 27, 2007
Sold by
Emc Mortgage Corp
Bought by
Boulware Raleigh J and Boulware Renee
Current Estimated Value
Home Financials for this Owner
Home Financials are based on the most recent Mortgage that was taken out on this home.
Original Mortgage
$34,000
Outstanding Balance
$14,495
Interest Rate
6.37%
Mortgage Type
Stand Alone Refi Refinance Of Original Loan
Estimated Equity
$681,164
Purchase Details
Closed on
Jul 5, 2006
Sold by
Nevil John
Bought by
Emc Mtg Corp
Purchase Details
Closed on
Jul 23, 2000
Sold by
Jim Hogan Homes Inc
Bought by
Nevil John
Home Financials for this Owner
Home Financials are based on the most recent Mortgage that was taken out on this home.
Original Mortgage
$330,540
Interest Rate
8.15%
Mortgage Type
New Conventional
Create a Home Valuation Report for This Property
The Home Valuation Report is an in-depth analysis detailing your home's value as well as a comparison with similar homes in the area
Home Values in the Area
Average Home Value in this Area
Purchase History
| Date | Buyer | Sale Price | Title Company |
|---|---|---|---|
| Boulware Raleigh J | $340,000 | -- | |
| Emc Mtg Corp | $401,130 | -- | |
| Nevil John | $413,200 | -- |
Source: Public Records
Mortgage History
| Date | Status | Borrower | Loan Amount |
|---|---|---|---|
| Open | Boulware Raleigh J | $34,000 | |
| Previous Owner | Nevil John | $330,540 |
Source: Public Records
Tax History
| Year | Tax Paid | Tax Assessment Tax Assessment Total Assessment is a certain percentage of the fair market value that is determined by local assessors to be the total taxable value of land and additions on the property. | Land | Improvement |
|---|---|---|---|---|
| 2025 | $8,547 | $293,840 | $53,120 | $240,720 |
| 2024 | $8,680 | $288,720 | $70,800 | $217,920 |
| 2023 | $8,680 | $270,400 | $60,000 | $210,400 |
| 2022 | $7,909 | $252,640 | $51,000 | $201,640 |
| 2021 | $6,953 | $200,840 | $41,280 | $159,560 |
| 2020 | $6,610 | $182,760 | $41,280 | $141,480 |
| 2019 | $6,380 | $182,760 | $41,280 | $141,480 |
| 2018 | $6,061 | $168,080 | $33,600 | $134,480 |
| 2016 | $5,700 | $157,280 | $27,600 | $129,680 |
| 2015 | $5,410 | $147,320 | $27,600 | $119,720 |
| 2014 | -- | $143,240 | $27,600 | $115,640 |
Source: Public Records
Map
Nearby Homes
- 2570 Wood Creek Ct
- 1104 Fairview Club Cir
- 964 Fairview Club Cir
- 2601 Wood Creek Ct NE
- 994 Fairview Club Cir
- 675 Timber Ives Dr
- 2713 Misty Rock Cove
- 747 Glen Valley Way
- 810 River Cove Dr
- 638 Glen Valley Way
- 755 Timber Ives Dr
- 722 Pathview Ct
- 732 Pathview Ct
- 802 Pathview Ct
- 2645 The Terraces Way
- 872 Pathview Ct
- 2592 White Aster Ln
- 2864 Misty Rock Cove
- 677 River Cove Ct
- 2934 Misty Rock Cove
- 751 Bentgrass Ct
- 781 Bentgrass Ct
- 741 Bentgrass Ct Unit 2
- 791 Bentgrass Ct
- 770 Bentgrass Ct
- 760 Bentgrass Ct
- 780 Bentgrass Ct
- 750 Bentgrass Ct
- 790 Bentgrass Ct
- 731 Bentgrass Ct
- 801 Bentgrass Ct
- 740 Bentgrass Ct
- 800 Bentgrass Ct
- 721 Bentgrass Ct
- 811 Bentgrass Ct
- 730 Bentgrass Ct
- 774 Fairview Club Cir
- 784 Fairview Club Cir
- 764 Fairview Club Cir
- 810 Bentgrass Ct
Your Personal Tour Guide
Ask me questions while you tour the home.