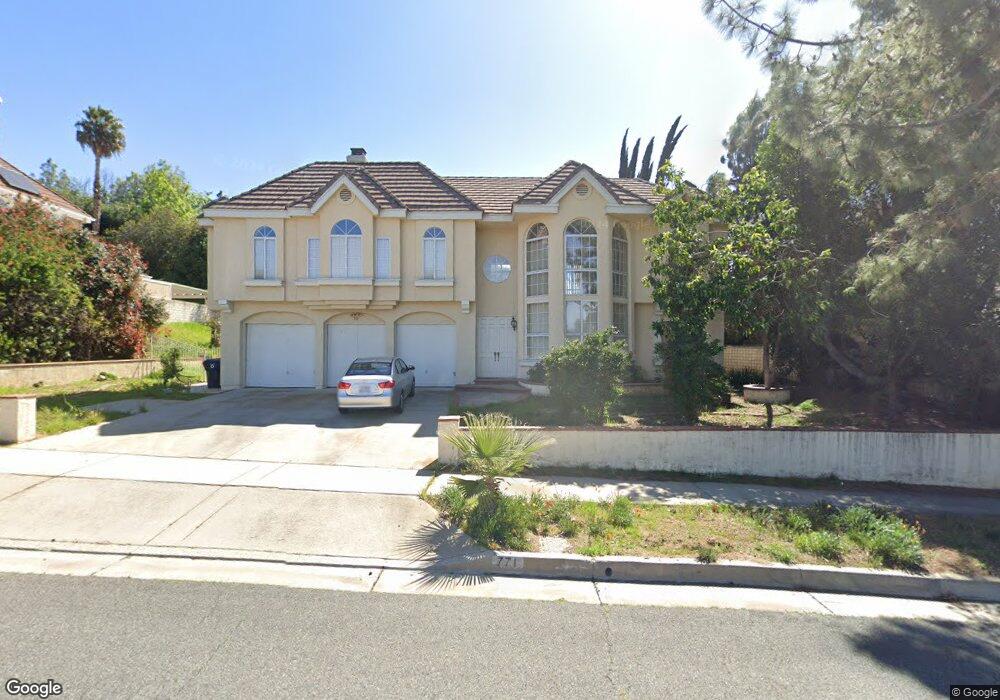
771 Devonshire Dr Redlands, CA 92374
South Redlands NeighborhoodEstimated Value: $850,000 - $1,027,000
4
Beds
3
Baths
2,659
Sq Ft
$352/Sq Ft
Est. Value
About This Home
This home is located at 771 Devonshire Dr, Redlands, CA 92374 and is currently estimated at $936,257, approximately $352 per square foot. 771 Devonshire Dr is a home located in San Bernardino County with nearby schools including Mariposa Elementary School, Moore Middle School, and Redlands East Valley High School.
Ownership History
Date
Name
Owned For
Owner Type
Purchase Details
Closed on
May 8, 2024
Sold by
Lee Michael S and Lee Michael Shuan
Bought by
Lee Revocable Living Trust and Lee
Current Estimated Value
Purchase Details
Closed on
Jun 4, 1998
Sold by
Lee Michael S
Bought by
Lee Michael S and Lee Shuan S
Purchase Details
Closed on
Dec 29, 1995
Sold by
Lee Shuan S
Bought by
Lee Michael S
Create a Home Valuation Report for This Property
The Home Valuation Report is an in-depth analysis detailing your home's value as well as a comparison with similar homes in the area
Home Values in the Area
Average Home Value in this Area
Purchase History
| Date | Buyer | Sale Price | Title Company |
|---|---|---|---|
| Lee Revocable Living Trust | -- | None Listed On Document | |
| Lee Michael S | -- | Fidelity National Title Ins | |
| Lee Michael S | -- | -- |
Source: Public Records
Tax History
| Year | Tax Paid | Tax Assessment Tax Assessment Total Assessment is a certain percentage of the fair market value that is determined by local assessors to be the total taxable value of land and additions on the property. | Land | Improvement |
|---|---|---|---|---|
| 2025 | $5,728 | $462,210 | $115,617 | $346,593 |
| 2024 | $5,351 | $453,147 | $113,350 | $339,797 |
| 2023 | $5,343 | $444,261 | $111,127 | $333,134 |
| 2022 | $5,265 | $435,550 | $108,948 | $326,602 |
| 2021 | $5,314 | $427,010 | $106,812 | $320,198 |
| 2020 | $5,279 | $422,632 | $105,717 | $316,915 |
| 2019 | $5,131 | $414,345 | $103,644 | $310,701 |
| 2018 | $5,003 | $406,221 | $101,612 | $304,609 |
| 2017 | $4,960 | $398,256 | $99,620 | $298,636 |
| 2016 | $4,903 | $390,447 | $97,667 | $292,780 |
| 2015 | $4,868 | $384,582 | $96,200 | $288,382 |
| 2014 | $4,777 | $377,049 | $94,316 | $282,733 |
Source: Public Records
Map
Nearby Homes
- 512 Golden West Dr
- 1388 Brandon Ct
- 1550 Marion Rd
- 505 E Sunset Dr N
- 225 Sunset Dr
- 533 Via Vista Dr
- 1370 Oak St
- 1514 Franklin Ave
- 1641 Ford St
- 1410 Pleasantview Dr
- 221 E Sunset Dr N
- 0 E Sunset Dr N
- 1582 Franklin Ave
- 0 Fairway Dr Unit HD26042118
- 1617 Garden St
- 1442 Moore St
- 1525 Garden St
- 1200 E Highland Ave Unit 207
- 1452 Moore St
- 1458 Moore St
- 767 Devonshire Dr
- 775 Devonshire Dr
- 812 Concord Ln
- 770 Concord Ln
- 816 Concord Ln
- 763 Devonshire Dr
- 766 Concord Ln
- 759 Devonshire Dr
- 762 Concord Ln
- 811 Concord Ln
- 769 Concord Ln
- 815 Concord Ln
- 1616 Sheffield Ln
- 755 Devonshire Dr
- 1609 Sheffield Ln
- 1620 Sheffield Ln
- 808 Lexington Ln
- 804 Lexington Ln
- 812 Lexington Ln
- 1613 Sheffield Ln
Your Personal Tour Guide
Ask me questions while you tour the home.