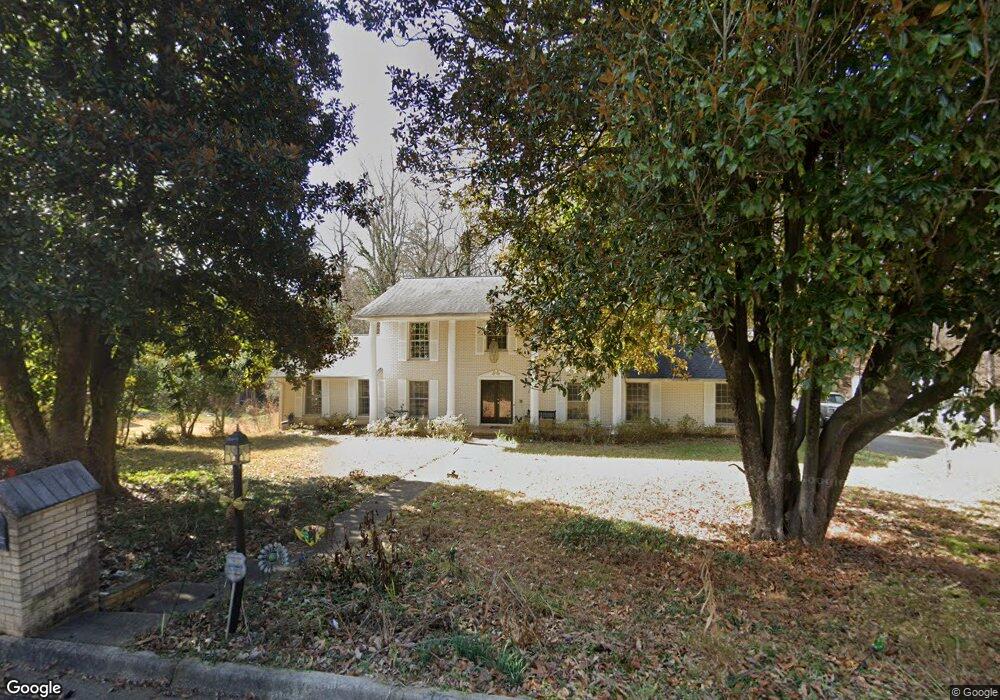
771 Little John Cir Gainesville, GA 30501
Estimated Value: $419,400 - $477,000
4
Beds
4
Baths
2,668
Sq Ft
$169/Sq Ft
Est. Value
About This Home
This home is located at 771 Little John Cir, Gainesville, GA 30501 and is currently estimated at $451,600, approximately $169 per square foot. 771 Little John Cir is a home located in Hall County with nearby schools including New Holland Core Knowledge Academy, Gainesville Middle School, and Gainesville High School.
Ownership History
Date
Name
Owned For
Owner Type
Purchase Details
Closed on
Aug 29, 2014
Sold by
Mccall Thuytien Lam
Bought by
Boswell Christopher Douglas and Boswell Trinh Kim
Current Estimated Value
Purchase Details
Closed on
Oct 14, 2010
Sold by
Dongol Ram R and Dongol Trinh K
Bought by
Mccall Thuytien
Purchase Details
Closed on
Jan 29, 1999
Sold by
Do Hieu V
Bought by
Dongol Ram R and Dongol Trinh K
Home Financials for this Owner
Home Financials are based on the most recent Mortgage that was taken out on this home.
Original Mortgage
$80,000
Interest Rate
6.8%
Mortgage Type
New Conventional
Purchase Details
Closed on
Dec 19, 1994
Sold by
Tran Ha Thanh Lam Boi
Bought by
Vannguyen Ban Van and Do Hieu Vinh
Home Financials for this Owner
Home Financials are based on the most recent Mortgage that was taken out on this home.
Original Mortgage
$75,000
Interest Rate
9.26%
Create a Home Valuation Report for This Property
The Home Valuation Report is an in-depth analysis detailing your home's value as well as a comparison with similar homes in the area
Home Values in the Area
Average Home Value in this Area
Purchase History
| Date | Buyer | Sale Price | Title Company |
|---|---|---|---|
| Boswell Christopher Douglas | -- | -- | |
| Mccall Thuytien | -- | -- | |
| Dongol Ram R | $100,000 | -- | |
| Vannguyen Ban Van | $101,000 | -- |
Source: Public Records
Mortgage History
| Date | Status | Borrower | Loan Amount |
|---|---|---|---|
| Previous Owner | Dongol Ram R | $80,000 | |
| Previous Owner | Vannguyen Ban Van | $75,000 |
Source: Public Records
Tax History Compared to Growth
Tax History
| Year | Tax Paid | Tax Assessment Tax Assessment Total Assessment is a certain percentage of the fair market value that is determined by local assessors to be the total taxable value of land and additions on the property. | Land | Improvement |
|---|---|---|---|---|
| 2025 | $3,767 | $132,480 | $20,840 | $111,640 |
| 2024 | $3,678 | $128,440 | $19,640 | $108,800 |
| 2023 | $516 | $128,560 | $16,960 | $111,600 |
| 2022 | $466 | $98,960 | $14,760 | $84,200 |
| 2021 | $510 | $97,960 | $14,760 | $83,200 |
| 2020 | $2,577 | $85,720 | $13,320 | $72,400 |
| 2019 | $2,491 | $81,640 | $13,320 | $68,320 |
| 2018 | $469 | $79,040 | $16,640 | $62,400 |
| 2017 | $391 | $58,360 | $13,320 | $45,040 |
| 2016 | $1,768 | $58,360 | $13,320 | $45,040 |
| 2015 | $1,105 | $56,951 | $6,760 | $50,191 |
| 2014 | $1,105 | $56,951 | $6,760 | $50,191 |
Source: Public Records
Map
Nearby Homes
- 1505 Robinhood Trail
- 915 Charleston Ct
- 1971 Assembly (Lot 164) Cir
- 2728 Limestone Creek Dr
- 1387 Springdale Rd
- 1824 Kettle Crossing
- 1820 Kettle Crossing
- 33 Quarry St
- 18 Spring St
- 1436 Vine St NE
- 943 Parkhill Place
- 37 Spring St
- 1304 Vine St NE
- 15 Liberty St
- 17 Liberty St
- 19 Carolina St
- 1180 Springdale Rd
- 3 Liberty St
- 1 Spring St
- 1173 Saint Charles Place
- 789 Little John Cir
- 751 Little John Cir
- 790 Little John Cir
- 1697 Nottingham Dr
- 811 Little John Cir
- 756 Little John Cir
- 810 Little John Cir
- 1757 Nottingham Dr
- 1673 Nottingham Dr
- 0 Nottingham Dr Unit 7495005
- 768 Robinhood Trail
- 1714 Nottingham Dr
- 756 Robinhood Trail
- 1704 Nottingham Dr
- 1726 Nottingham Dr
- 1690 Nottingham Dr
- 738 Robinhood Trail
- 1787 Nottingham Dr
- 720 Robinhood Trail
- 1742 Nottingham Dr