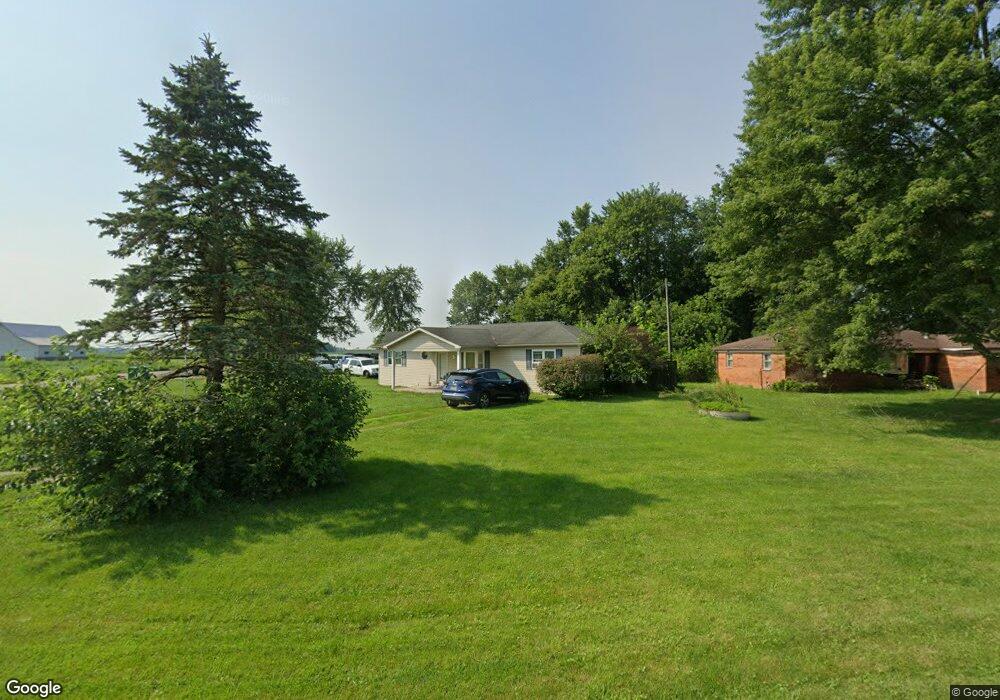
771 W 1100 N Fountaintown, IN 46130
Estimated Value: $178,000 - $208,000
3
Beds
1
Bath
1,200
Sq Ft
$163/Sq Ft
Est. Value
About This Home
This home is located at 771 W 1100 N, Fountaintown, IN 46130 and is currently estimated at $195,667, approximately $163 per square foot. 771 W 1100 N is a home located in Shelby County with nearby schools including Morristown Elementary School and Morristown Junior/Senior High School.
Ownership History
Date
Name
Owned For
Owner Type
Purchase Details
Closed on
Nov 1, 2020
Sold by
Hartford Machelle
Bought by
Smith Michael J
Current Estimated Value
Home Financials for this Owner
Home Financials are based on the most recent Mortgage that was taken out on this home.
Original Mortgage
$672,968
Outstanding Balance
$543,015
Interest Rate
2.8%
Mortgage Type
Commercial
Estimated Equity
-$347,348
Create a Home Valuation Report for This Property
The Home Valuation Report is an in-depth analysis detailing your home's value as well as a comparison with similar homes in the area
Home Values in the Area
Average Home Value in this Area
Purchase History
| Date | Buyer | Sale Price | Title Company |
|---|---|---|---|
| Smith Michael J | -- | Near North Title Group |
Source: Public Records
Mortgage History
| Date | Status | Borrower | Loan Amount |
|---|---|---|---|
| Open | Smith Michael J | $672,968 |
Source: Public Records
Tax History Compared to Growth
Tax History
| Year | Tax Paid | Tax Assessment Tax Assessment Total Assessment is a certain percentage of the fair market value that is determined by local assessors to be the total taxable value of land and additions on the property. | Land | Improvement |
|---|---|---|---|---|
| 2024 | $2,061 | $133,600 | $27,500 | $106,100 |
| 2023 | $2,048 | $129,700 | $27,500 | $102,200 |
| 2022 | $1,756 | $113,100 | $20,400 | $92,700 |
| 2021 | $1,685 | $107,800 | $20,400 | $87,400 |
| 2020 | $1,583 | $104,400 | $20,400 | $84,000 |
| 2019 | $1,580 | $105,400 | $19,600 | $85,800 |
| 2018 | $1,441 | $96,400 | $18,100 | $78,300 |
| 2017 | $1,402 | $98,300 | $18,100 | $80,200 |
| 2016 | $1,303 | $98,300 | $18,100 | $80,200 |
| 2014 | $1,269 | $98,400 | $18,100 | $80,300 |
| 2013 | $1,269 | $98,800 | $18,100 | $80,700 |
Source: Public Records
Map
Nearby Homes
- 10686 N Division Rd
- 6 U S 52
- 5 U S 52
- 11497 N State Road 9
- 11131 N State Road 9
- 83 E Walnut St
- 256 E 1000 N
- 11600 N 100 E
- 1069 W Railroad St
- 5477 S Main St
- 5465 S Greenfield St
- 661 W 500 S
- 11546 N Shelby 300 W
- 5555 S 200 E
- 4500 S 50 W
- 1546 E Osprey Dr
- 1898 E 1000 N
- 0 S 300 East- 2
- 1556 E 400 S
- 0 S 300 E