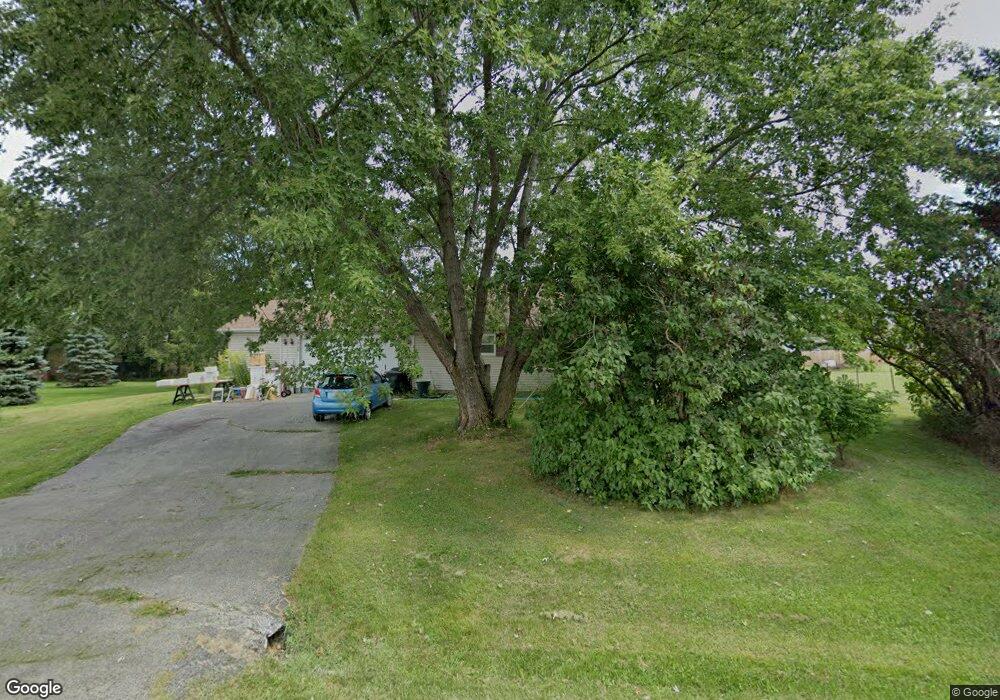
7710 Finch St Spring Grove, IL 60081
Estimated Value: $286,473 - $359,000
3
Beds
--
Bath
1,304
Sq Ft
$240/Sq Ft
Est. Value
About This Home
This home is located at 7710 Finch St, Spring Grove, IL 60081 and is currently estimated at $313,118, approximately $240 per square foot. 7710 Finch St is a home located in McHenry County with nearby schools including Spring Grove Elementary School, Nippersink Middle School, and Richmond-Burton High School.
Ownership History
Date
Name
Owned For
Owner Type
Purchase Details
Closed on
Aug 16, 2005
Sold by
Welter Joseph M and Welter Elizabeth M
Bought by
Mccray Gene L and Mccray Marsha J
Current Estimated Value
Home Financials for this Owner
Home Financials are based on the most recent Mortgage that was taken out on this home.
Original Mortgage
$35,850
Interest Rate
5.82%
Mortgage Type
Stand Alone Second
Purchase Details
Closed on
Nov 8, 2002
Sold by
Hatfield Jeremy S and Hatfield Amanda M
Bought by
Welter Joseph M and Welter Elizabeth M
Home Financials for this Owner
Home Financials are based on the most recent Mortgage that was taken out on this home.
Original Mortgage
$148,000
Interest Rate
8.86%
Purchase Details
Closed on
May 3, 2002
Sold by
Aubert August W and Aubert Denise M
Bought by
Hatfield Jeremy S and Hatfield Amanda M
Home Financials for this Owner
Home Financials are based on the most recent Mortgage that was taken out on this home.
Original Mortgage
$100,000
Interest Rate
7.24%
Create a Home Valuation Report for This Property
The Home Valuation Report is an in-depth analysis detailing your home's value as well as a comparison with similar homes in the area
Home Values in the Area
Average Home Value in this Area
Purchase History
| Date | Buyer | Sale Price | Title Company |
|---|---|---|---|
| Mccray Gene L | $239,000 | Pntn | |
| Welter Joseph M | -- | -- | |
| Hatfield Jeremy S | -- | -- |
Source: Public Records
Mortgage History
| Date | Status | Borrower | Loan Amount |
|---|---|---|---|
| Closed | Mccray Gene L | $35,850 | |
| Open | Mccray Gene L | $191,200 | |
| Previous Owner | Welter Joseph M | $148,000 | |
| Previous Owner | Hatfield Jeremy S | $100,000 |
Source: Public Records
Tax History Compared to Growth
Tax History
| Year | Tax Paid | Tax Assessment Tax Assessment Total Assessment is a certain percentage of the fair market value that is determined by local assessors to be the total taxable value of land and additions on the property. | Land | Improvement |
|---|---|---|---|---|
| 2024 | $3,691 | $83,871 | $19,325 | $64,546 |
| 2023 | $3,947 | $76,671 | $17,666 | $59,005 |
| 2022 | $5,460 | $69,036 | $15,907 | $53,129 |
| 2021 | $5,278 | $66,259 | $15,267 | $50,992 |
| 2020 | $5,187 | $63,754 | $14,690 | $49,064 |
| 2019 | $5,120 | $61,705 | $14,218 | $47,487 |
| 2018 | $5,156 | $59,156 | $13,631 | $45,525 |
| 2017 | $5,145 | $56,334 | $12,981 | $43,353 |
| 2016 | $5,049 | $52,816 | $12,170 | $40,646 |
| 2013 | -- | $49,938 | $11,507 | $38,431 |
Source: Public Records
Map
Nearby Homes
- 2150 U S 12
- 2214 Main Street Rd
- 1992 Red Oak Ln
- 1996 Red Oak Ln
- 2620 Rolling Oaks Rd
- 2003 Red Oak Ln
- LOT 9 Mayo Ct
- 7397 English Oak Ln
- 1876 Red Oak Ln
- Lot 36 Red Oak Ln
- LOT 40 Red Oak Ln
- 7393 English Oak Ln
- 7416 Briar Ct
- 7377 English Oak Ln
- 7389 English Oak Ln
- 7381 English Oak Ln
- 7392 English Oak Ln
- 7373 English Oak Ln
- 1979 Red Oak Ln
- 7388 English Oak Ln
- 7718 Finch St
- 7709 Utility St
- 7703 Utility St
- 7711 Utility St
- 2314 Westward Dr
- 2300 Westward Dr
- 2318 Westward Dr
- 2400 Highview St Unit 3
- 2400 Highview St Unit 1
- 2400 Highview St
- 7712 Utility Ct
- 7710 Utility St
- 7712 Utility St
- 7708 Utility Ct
- 7702 Utility St
- 2401 Westward Dr
- 7727 Finch St
- 2302 U S 12 Unit REAR
- 2302 U S 12
- 2310 N Us Highway 12