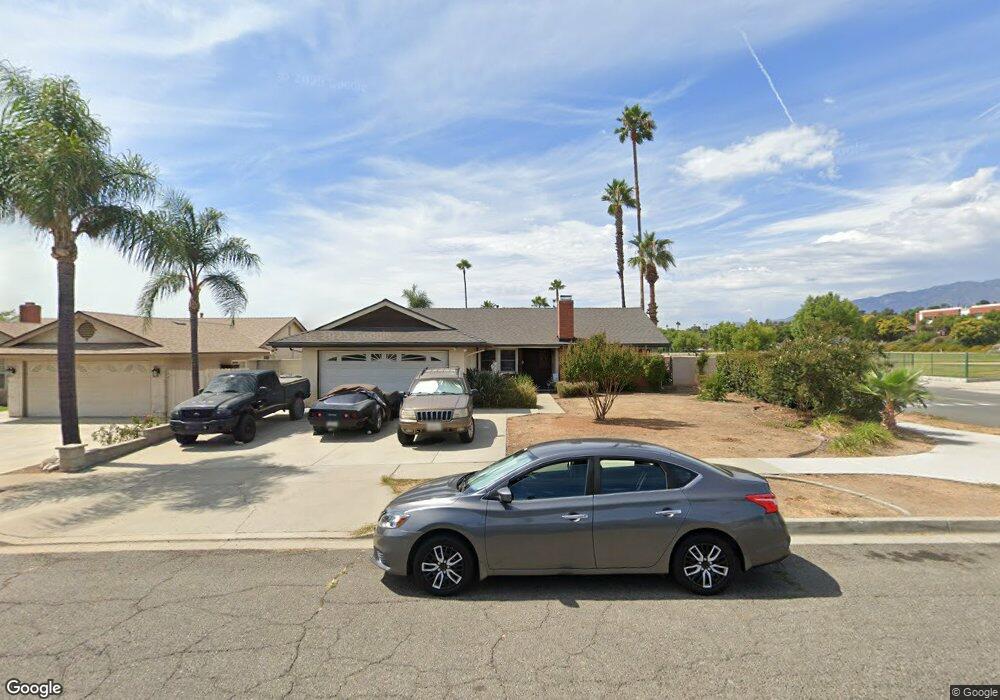
7710 Layton St Rancho Cucamonga, CA 91730
Estimated Value: $685,000 - $730,000
3
Beds
2
Baths
1,276
Sq Ft
$552/Sq Ft
Est. Value
About This Home
This home is located at 7710 Layton St, Rancho Cucamonga, CA 91730 and is currently estimated at $704,933, approximately $552 per square foot. 7710 Layton St is a home located in San Bernardino County with nearby schools including Central Elementary, Cucamonga Middle, and Alta Loma High.
Ownership History
Date
Name
Owned For
Owner Type
Purchase Details
Closed on
Dec 3, 2002
Sold by
Miller Marie A
Bought by
Miller Chad L
Current Estimated Value
Home Financials for this Owner
Home Financials are based on the most recent Mortgage that was taken out on this home.
Original Mortgage
$220,500
Outstanding Balance
$94,123
Interest Rate
6.28%
Estimated Equity
$610,810
Purchase Details
Closed on
Nov 13, 2002
Sold by
Schafer James
Bought by
Miller Chad L
Home Financials for this Owner
Home Financials are based on the most recent Mortgage that was taken out on this home.
Original Mortgage
$220,500
Outstanding Balance
$94,123
Interest Rate
6.28%
Estimated Equity
$610,810
Purchase Details
Closed on
May 18, 2001
Sold by
Schullein Rebecca
Bought by
Schafer James
Purchase Details
Closed on
Mar 23, 1999
Sold by
Va
Bought by
Shimansky Robert and Shimansky Kathie
Home Financials for this Owner
Home Financials are based on the most recent Mortgage that was taken out on this home.
Original Mortgage
$131,073
Interest Rate
7.04%
Mortgage Type
FHA
Purchase Details
Closed on
Feb 26, 1999
Sold by
Dva Shimansky Robert and Dva Kathie K
Bought by
Schafer James and Schafer Rebecca
Home Financials for this Owner
Home Financials are based on the most recent Mortgage that was taken out on this home.
Original Mortgage
$131,073
Interest Rate
7.04%
Mortgage Type
FHA
Create a Home Valuation Report for This Property
The Home Valuation Report is an in-depth analysis detailing your home's value as well as a comparison with similar homes in the area
Home Values in the Area
Average Home Value in this Area
Purchase History
| Date | Buyer | Sale Price | Title Company |
|---|---|---|---|
| Miller Chad L | -- | First American | |
| Miller Chad L | $245,000 | First American | |
| Schafer James | -- | -- | |
| Shimansky Robert | -- | Fidelity Title | |
| Schafer James | $132,000 | Fidelity Title |
Source: Public Records
Mortgage History
| Date | Status | Borrower | Loan Amount |
|---|---|---|---|
| Open | Miller Chad L | $220,500 | |
| Previous Owner | Schafer James | $131,073 |
Source: Public Records
Tax History Compared to Growth
Tax History
| Year | Tax Paid | Tax Assessment Tax Assessment Total Assessment is a certain percentage of the fair market value that is determined by local assessors to be the total taxable value of land and additions on the property. | Land | Improvement |
|---|---|---|---|---|
| 2025 | $3,792 | $354,845 | $124,195 | $230,650 |
| 2024 | $3,792 | $347,887 | $121,760 | $226,127 |
| 2023 | $3,708 | $341,066 | $119,373 | $221,693 |
| 2022 | $3,648 | $334,378 | $117,032 | $217,346 |
| 2021 | $3,645 | $327,821 | $114,737 | $213,084 |
| 2020 | $3,541 | $324,460 | $113,561 | $210,899 |
| 2019 | $3,523 | $318,098 | $111,334 | $206,764 |
| 2018 | $3,423 | $311,861 | $109,151 | $202,710 |
| 2017 | $3,360 | $305,746 | $107,011 | $198,735 |
| 2016 | $3,319 | $299,751 | $104,913 | $194,838 |
| 2015 | $3,282 | $295,248 | $103,337 | $191,911 |
| 2014 | $3,186 | $289,465 | $101,313 | $188,152 |
Source: Public Records
Map
Nearby Homes
- 7730 Layton St
- 9364 Langston St
- 7534 Layton St
- 9599 Church St
- 7739 Lion St
- 9684 Hemlock St
- 9464 Magnolia St
- 9757 Louise Way
- 9471 Jack Rabbit Dr Unit 107
- 8024 Tulsa Place
- 9340 Foothill Blvd Unit 68
- 9340 Foothill Blvd
- 9340 Foothill Blvd Unit 61
- 9812 Casiano Ct
- 7864 Portola Rd
- 7315 Klusman Ave
- 9854 Madera Ct
- 8980 Balsa St
- 9880 Madera Ct
- 8926 Yew St