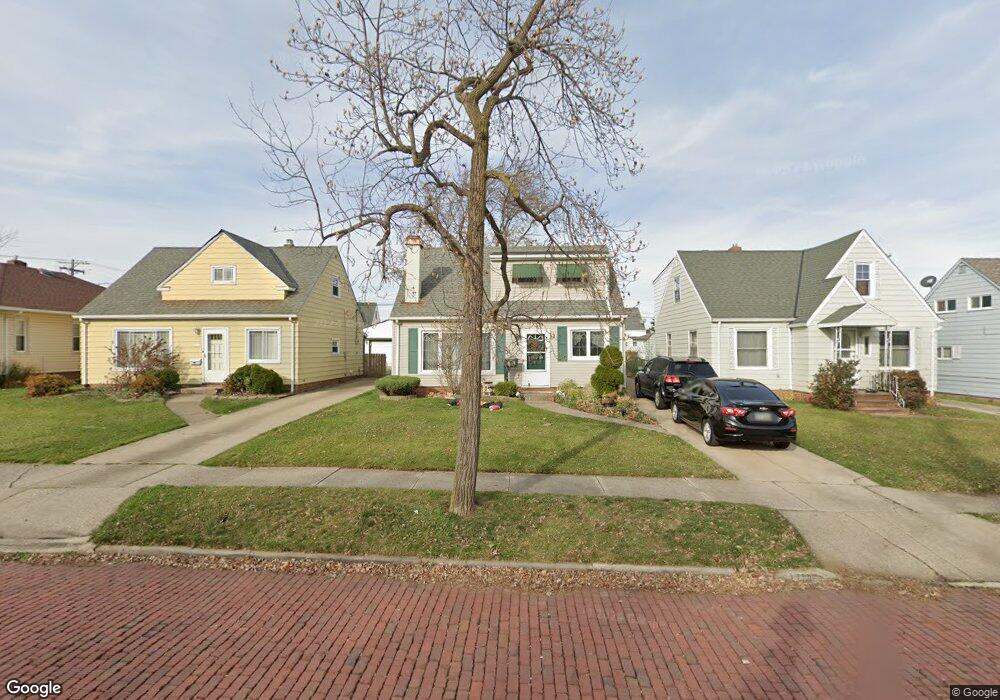
7710 Newport Ave Cleveland, OH 44129
Estimated Value: $177,606 - $195,000
3
Beds
1
Bath
1,100
Sq Ft
$170/Sq Ft
Est. Value
About This Home
This home is located at 7710 Newport Ave, Cleveland, OH 44129 and is currently estimated at $186,902, approximately $169 per square foot. 7710 Newport Ave is a home located in Cuyahoga County with nearby schools including Ridge-Brook Elementary School, Greenbriar Middle School, and Parma High School.
Ownership History
Date
Name
Owned For
Owner Type
Purchase Details
Closed on
Aug 19, 2011
Sold by
Vitteck Jeannine L
Bought by
Cantrell Tara N
Current Estimated Value
Home Financials for this Owner
Home Financials are based on the most recent Mortgage that was taken out on this home.
Original Mortgage
$77,874
Outstanding Balance
$56,192
Interest Rate
5.5%
Mortgage Type
FHA
Estimated Equity
$130,710
Purchase Details
Closed on
Mar 29, 1993
Sold by
Janek Lewis E
Bought by
Vitteck Jeannine L
Purchase Details
Closed on
May 25, 1990
Sold by
Wolfe Donald R
Bought by
Janek Lewis E
Purchase Details
Closed on
Dec 18, 1987
Sold by
Wolfe Donald R
Bought by
Wolfe Donald R
Purchase Details
Closed on
Mar 25, 1982
Sold by
Frank Pauline
Bought by
Wolfe Donald R
Purchase Details
Closed on
Jan 1, 1975
Bought by
Frank Pauline
Create a Home Valuation Report for This Property
The Home Valuation Report is an in-depth analysis detailing your home's value as well as a comparison with similar homes in the area
Home Values in the Area
Average Home Value in this Area
Purchase History
| Date | Buyer | Sale Price | Title Company |
|---|---|---|---|
| Cantrell Tara N | $79,900 | Stewart Title Agency | |
| Vitteck Jeannine L | $72,600 | -- | |
| Janek Lewis E | $65,500 | -- | |
| Wolfe Donald R | -- | -- | |
| Wolfe Donald R | $43,000 | -- | |
| Frank Pauline | -- | -- |
Source: Public Records
Mortgage History
| Date | Status | Borrower | Loan Amount |
|---|---|---|---|
| Open | Cantrell Tara N | $77,874 |
Source: Public Records
Tax History Compared to Growth
Tax History
| Year | Tax Paid | Tax Assessment Tax Assessment Total Assessment is a certain percentage of the fair market value that is determined by local assessors to be the total taxable value of land and additions on the property. | Land | Improvement |
|---|---|---|---|---|
| 2024 | $3,393 | $55,615 | $9,940 | $45,675 |
| 2023 | $2,631 | $36,400 | $8,190 | $28,210 |
| 2022 | $2,606 | $36,400 | $8,190 | $28,210 |
| 2021 | $2,678 | $36,400 | $8,190 | $28,210 |
| 2020 | $2,350 | $28,000 | $6,300 | $21,700 |
| 2019 | $2,245 | $80,000 | $18,000 | $62,000 |
| 2018 | $2,065 | $28,000 | $6,300 | $21,700 |
| 2017 | $2,031 | $23,280 | $4,410 | $18,870 |
| 2016 | $2,020 | $23,280 | $4,410 | $18,870 |
| 2015 | $1,978 | $23,280 | $4,410 | $18,870 |
| 2014 | $1,978 | $24,750 | $4,690 | $20,060 |
Source: Public Records
Map
Nearby Homes
- 7707 Liberty Ave
- 8206 Newport Ave
- 8018 Pinegrove Ave
- 6606 Theota Ave
- 8119 Pinegrove Ave
- 6211 Luelda Ave
- 6014 Laverne Ave
- 6508 Delora Ave
- 5906 Velma Ave
- 7609 Wooster Pkwy
- 6306 Flowerdale Ave
- 6011 Theota Ave
- 5810 Laverne Ave
- 9118 Fernhill Ave
- 6209 Archmere Ave
- 6025 Northcliff Ave
- 5618 Bradley Ave
- 6903 Forest Ave
- 5901 Delora Ave
- 5511 Velma Ave
- 7706 Newport Ave
- 7714 Newport Ave
- 7702 Newport Ave
- 7718 Newport Ave
- 7618 Newport Ave
- 7711 Liberty Ave
- 7715 Liberty Ave
- 7719 Liberty Ave
- 7703 Liberty Ave
- 7614 Newport Ave
- 7802 Newport Ave
- 7711 Newport Ave
- 7707 Newport Ave
- 7715 Newport Ave
- 7703 Newport Ave
- 7615 Liberty Ave
- 7610 Newport Ave
- 7803 Liberty Ave
- 7619 Newport Ave
- 7806 Newport Ave