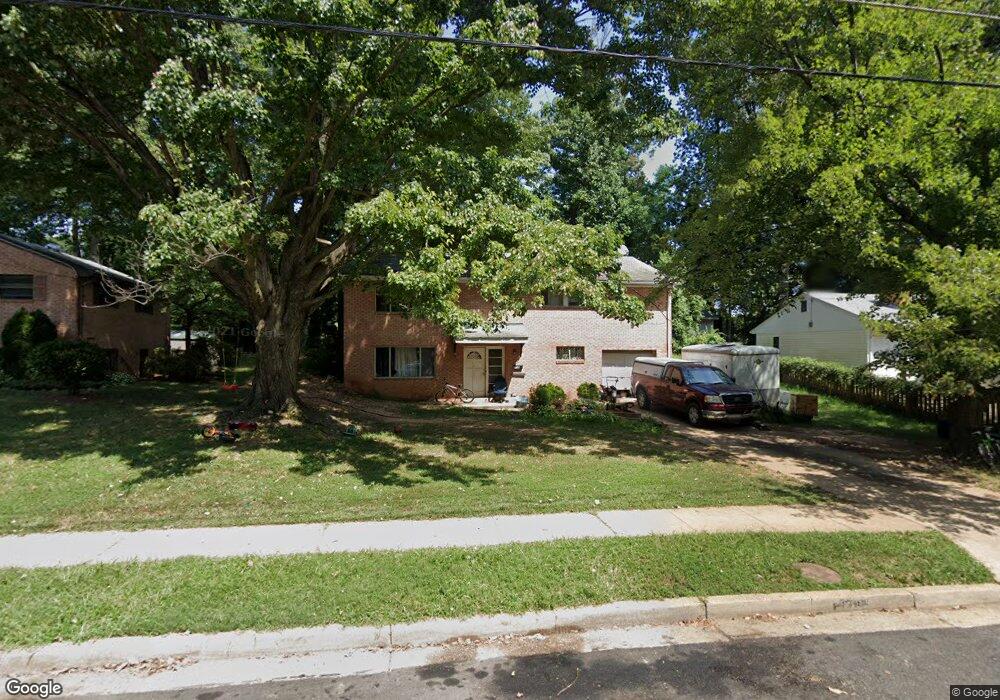
7710 Viceroy St Springfield, VA 22151
Estimated Value: $691,275 - $721,000
4
Beds
3
Baths
1,260
Sq Ft
$564/Sq Ft
Est. Value
About This Home
This home is located at 7710 Viceroy St, Springfield, VA 22151 and is currently estimated at $710,819, approximately $564 per square foot. 7710 Viceroy St is a home located in Fairfax County with nearby schools including North Springfield Elementary School, Holmes Middle School, and Annandale High School.
Ownership History
Date
Name
Owned For
Owner Type
Purchase Details
Closed on
Jun 22, 1999
Sold by
Ngo Phuc D
Bought by
Le Linh
Current Estimated Value
Home Financials for this Owner
Home Financials are based on the most recent Mortgage that was taken out on this home.
Original Mortgage
$199,500
Outstanding Balance
$53,222
Interest Rate
7.19%
Estimated Equity
$657,597
Purchase Details
Closed on
Feb 18, 1999
Sold by
Lunn Maria E
Bought by
Ngo Phuc D
Home Financials for this Owner
Home Financials are based on the most recent Mortgage that was taken out on this home.
Original Mortgage
$166,250
Interest Rate
6.76%
Purchase Details
Closed on
Dec 9, 1993
Sold by
Gibson A L
Bought by
Lunn Maria E
Home Financials for this Owner
Home Financials are based on the most recent Mortgage that was taken out on this home.
Original Mortgage
$170,000
Interest Rate
6.78%
Create a Home Valuation Report for This Property
The Home Valuation Report is an in-depth analysis detailing your home's value as well as a comparison with similar homes in the area
Home Values in the Area
Average Home Value in this Area
Purchase History
| Date | Buyer | Sale Price | Title Company |
|---|---|---|---|
| Le Linh | $210,000 | -- | |
| Ngo Phuc D | $175,000 | -- | |
| Lunn Maria E | $170,000 | -- |
Source: Public Records
Mortgage History
| Date | Status | Borrower | Loan Amount |
|---|---|---|---|
| Open | Le Linh | $199,500 | |
| Previous Owner | Ngo Phuc D | $166,250 | |
| Previous Owner | Lunn Maria E | $170,000 |
Source: Public Records
Tax History Compared to Growth
Tax History
| Year | Tax Paid | Tax Assessment Tax Assessment Total Assessment is a certain percentage of the fair market value that is determined by local assessors to be the total taxable value of land and additions on the property. | Land | Improvement |
|---|---|---|---|---|
| 2025 | $6,895 | $627,350 | $267,000 | $360,350 |
| 2024 | $6,895 | $595,190 | $252,000 | $343,190 |
| 2023 | $6,544 | $579,840 | $243,000 | $336,840 |
| 2022 | $6,095 | $533,040 | $214,000 | $319,040 |
| 2021 | $5,270 | $449,100 | $197,000 | $252,100 |
| 2020 | $5,315 | $449,100 | $197,000 | $252,100 |
| 2019 | $5,315 | $449,100 | $197,000 | $252,100 |
| 2018 | $4,901 | $426,180 | $197,000 | $229,180 |
| 2017 | $4,743 | $408,500 | $186,000 | $222,500 |
| 2016 | $4,605 | $397,500 | $175,000 | $222,500 |
| 2015 | $4,308 | $386,020 | $170,000 | $216,020 |
| 2014 | $4,218 | $378,780 | $167,000 | $211,780 |
Source: Public Records
Map
Nearby Homes
- 7538 Axton St
- 7520 Murillo St
- 7414 Chatham St
- 7918 Hatteras Ln
- 7310 Leesville Blvd
- 7525 Jervis St
- 7228 Evanston Rd
- 5301 Ferndale St
- 5807 Accomac St
- 7314 Inzer St
- 7212 Highland St
- 7435 Bath St
- 5206 Ferndale St
- 7118 Kerr Dr
- 7203 Homestead Place
- 7317 Floyd Ave
- 5206 Easton Dr
- 7757 Carrleigh Pkwy
- 5005 Ravensworth Rd
- 5004 Terrell St
- 7708 Viceroy St
- 7712 Viceroy St
- 7706 Viceroy St
- 7714 Viceroy St
- 7705 Viceroy St
- 7707 Viceroy St
- 7703 Viceroy St
- 7709 Viceroy St
- 7704 Viceroy St
- 7716 Viceroy St
- 7701 Viceroy St
- 7711 Viceroy St
- 5619 Queensberry Ave
- 7718 Viceroy St
- 5621 Queensberry Ave
- 5617 Queensberry Ave
- 7702 Viceroy St
- 5602 Viceroy Ct
- 5615 Queensberry Ave
- 7719 Viceroy St