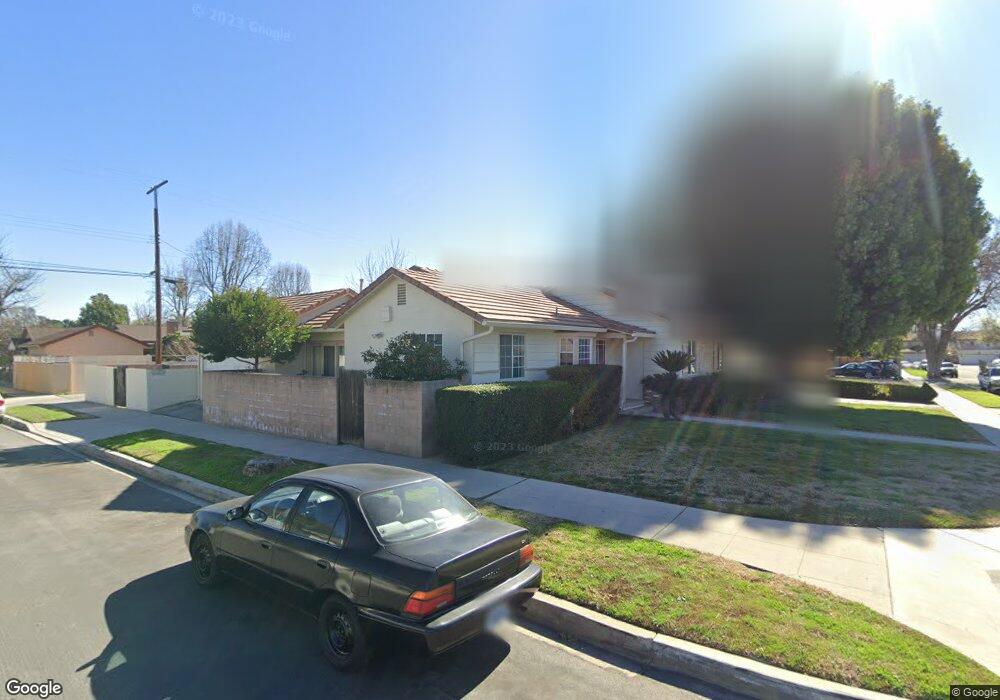
7712 Sunnybrae Ave Winnetka, CA 91306
Estimated Value: $862,647 - $955,000
3
Beds
2
Baths
1,863
Sq Ft
$485/Sq Ft
Est. Value
About This Home
This home is located at 7712 Sunnybrae Ave, Winnetka, CA 91306 and is currently estimated at $902,662, approximately $484 per square foot. 7712 Sunnybrae Ave is a home located in Los Angeles County with nearby schools including Sunny Brae Avenue Elementary School, John A. Sutter Middle School, and Canoga Park Senior High School.
Ownership History
Date
Name
Owned For
Owner Type
Purchase Details
Closed on
Sep 29, 2011
Sold by
Tenen Shelley
Bought by
Tenen Neal C E and Tenen Shelley G
Current Estimated Value
Home Financials for this Owner
Home Financials are based on the most recent Mortgage that was taken out on this home.
Original Mortgage
$190,000
Outstanding Balance
$18,028
Interest Rate
4.16%
Mortgage Type
New Conventional
Estimated Equity
$884,634
Purchase Details
Closed on
Nov 30, 2010
Sold by
Tenen Neal C E and Tenen Shelley G
Bought by
Tenen Neal C E and Tenen Shelley G
Purchase Details
Closed on
Aug 21, 2000
Sold by
Tenen Neal C and Tenen Shelley G
Bought by
Tenen Shelley G
Home Financials for this Owner
Home Financials are based on the most recent Mortgage that was taken out on this home.
Original Mortgage
$210,500
Interest Rate
8.15%
Create a Home Valuation Report for This Property
The Home Valuation Report is an in-depth analysis detailing your home's value as well as a comparison with similar homes in the area
Home Values in the Area
Average Home Value in this Area
Purchase History
| Date | Buyer | Sale Price | Title Company |
|---|---|---|---|
| Tenen Neal C E | -- | Lawyers Title Vn | |
| Tenen Shelley | -- | Lawyers Title Vn | |
| Tenen Shelley | -- | Lawyers Title Vn | |
| Tenen Neal C E | -- | None Available | |
| Tenen Neal C E | -- | None Available | |
| Tenen Shelley G | -- | -- |
Source: Public Records
Mortgage History
| Date | Status | Borrower | Loan Amount |
|---|---|---|---|
| Open | Tenen Neal C E | $190,000 | |
| Closed | Tenen Shelley G | $210,500 |
Source: Public Records
Tax History Compared to Growth
Tax History
| Year | Tax Paid | Tax Assessment Tax Assessment Total Assessment is a certain percentage of the fair market value that is determined by local assessors to be the total taxable value of land and additions on the property. | Land | Improvement |
|---|---|---|---|---|
| 2025 | $2,813 | $220,366 | $66,364 | $154,002 |
| 2024 | $2,813 | $216,046 | $65,063 | $150,983 |
| 2023 | $2,762 | $211,811 | $63,788 | $148,023 |
| 2022 | $2,638 | $207,659 | $62,538 | $145,121 |
| 2021 | $2,595 | $203,588 | $61,312 | $142,276 |
| 2019 | $2,519 | $197,552 | $59,495 | $138,057 |
| 2018 | $2,434 | $193,679 | $58,329 | $135,350 |
| 2016 | $2,305 | $186,161 | $56,065 | $130,096 |
| 2015 | $2,272 | $183,365 | $55,223 | $128,142 |
| 2014 | $2,287 | $179,774 | $54,142 | $125,632 |
Source: Public Records
Map
Nearby Homes
- 20431 Stagg St
- 7614 Mason Ave
- 20551 Saticoy St
- 20448 Arminta St
- 20646 Hatton St
- 7800 Fairchild Ave
- 20329 Stagg St
- 7812 Fairchild Ave
- 20722 Keswick St
- 7830 Fairchild Ave
- 7463 Mason Ave
- 20650 Covello St
- 20254 Stagg St
- 20253 Keswick St Unit 326
- 20253 Keswick St Unit 105
- 7640 Oso Ave Unit 316
- 7640 Oso Ave Unit 217
- 7933 Casaba Ave
- 7801 Kelvin Ave
- 20235 Keswick St Unit 102
- 7706 Sunnybrae Ave
- 7700 Sunnybrae Ave
- 7724 Sunnybrae Ave
- 7713 Mason Ave
- 7707 Mason Ave
- 20532 Keswick St
- 7701 Mason Ave
- 7727 Mason Ave
- 20533 Keswick St
- 7732 Sunnybrae Ave
- 7654 Sunnybrae Ave
- 20532 Stagg St
- 7731 Mason Ave Unit ADU
- 7733 Mason Ave
- 7655 Mason Ave
- 20540 Keswick St
- 7738 Sunnybrae Ave
- 20540 Stagg St
- 7655 Sunnybrae Ave
- 20545 Keswick St